
2022/23 | Climate Change Report
Our purpose is to protect the future of millions of people throughout the UK who belong to defined benefit (DB) pensionschemes. Should a scheme fail, we’re ready to help
2022/23 Climate Change Report Best UK Pension Fund (joint winner) – IPE Awards, December 2022
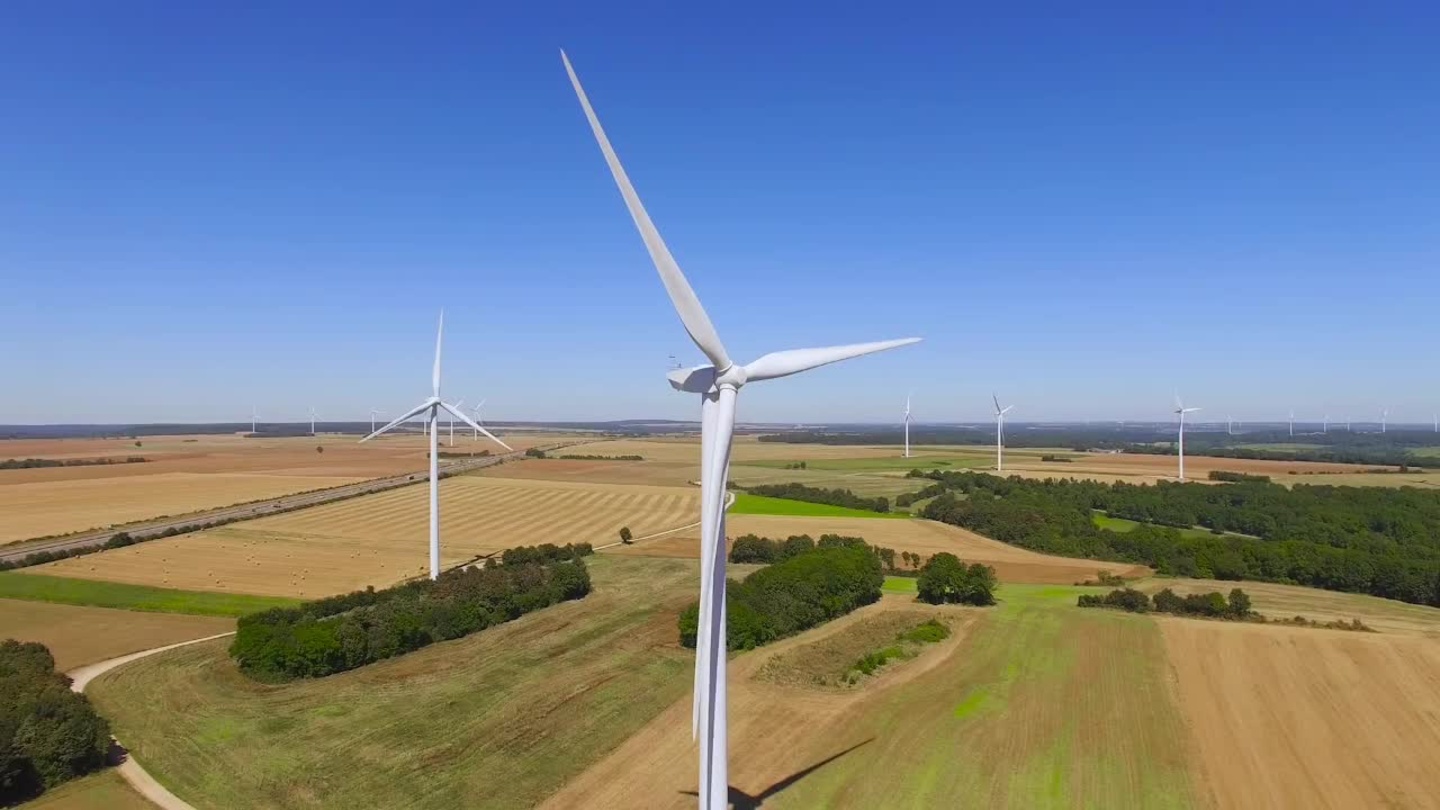
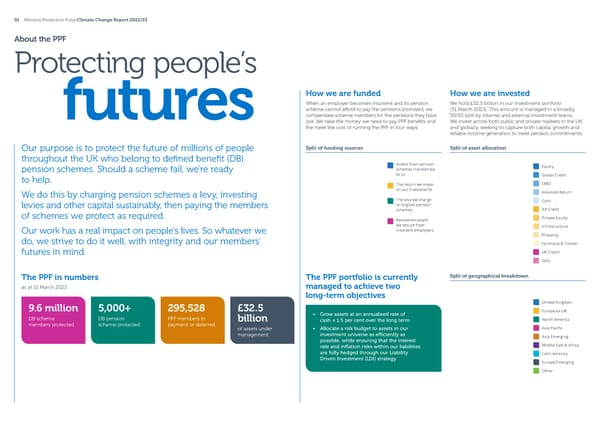
01 Pension Protection Fund Climate Change Report 2022/23 About the PPF Protecting people’s How we are funded How we are invested When an employer becomes insolvent and its pension We hold £32.5 billion in our investment portfolio scheme cannot a昀昀ord to pay the pensions promised, we (31 March 2023). This amount is managed in a broadly futures compensate scheme members for the pensions they have 50/50 split by internal and external investment teams. lost. We raise the money we need to pay PPF bene昀椀ts and We invest across both public and private markets in the UK the meet the cost of running the PPF in four ways: and globally, seeking to capture both capital growth and reliable income generation to meet pension commitments. Our purpose is to protect the future of millions of people Split of funding sources Split of asset allocation throughout the UK who belong to de昀椀ned bene昀椀t (DB) Assets from pension Equity pension schemes. Should a scheme fail, we’re ready schemes transferred to help. to us Global Credit The return we make EMD We do this by charging pension schemes a levy, investing on our investments Absolute Return The levy we charge Cash levies and other capital sustainably, then paying the members on eligible pension schemes Alt Credit of schemes we protect as required. Recovered assets Private Equity we secure from Infrastructure Our work has a real impact on people’s lives. So whatever we insolvent employers do, we strive to do it well, with integrity and our members’ Property Farmland & Timber futures in mind. UK Credit Gilts The PPF in numbers The PPF portfolio is currently Split of geographical breakdown as at 31 March 2023 managed to achieve two long-term objectives 9.6 million 5,000+ 295,528 £32.5 United Kingdom • Grow assets at an annualised rate of Europe ex UK DB scheme DB pension PPF members in billion cash + 1.5 per cent over the long term North America members protected scheme protected payment or deferred of assets under • Allocate a risk budget to assets in our Asia Pacific management investment universe as e昀케ciently as Asia Emerging possible, while ensuring that the interest rate and in昀氀ation risks within our liabilities Middle East & Africa are fully hedged through our Liability Latin America Driven Investment (LDI) strategy Europe Emerging Other
0202 PPeennssiioon Pn Prrototeeccttiioon Fn Fuunndd C Clliimmaatte Ce Chhaanngge Re Reeppoorrt 2t 2020222//2233 Contents 03 Introduction from our Chair 04 Key achievements 05 O verview: Make every investment transparent and accountable 06 Our progress at a glance 07 Governance and accountability 10 Strategy and risk management 19 Metrics and progress 36 Setting aspirational targets 37 Appendices

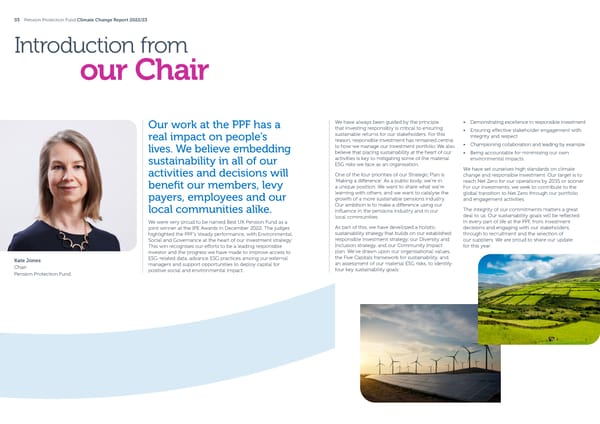
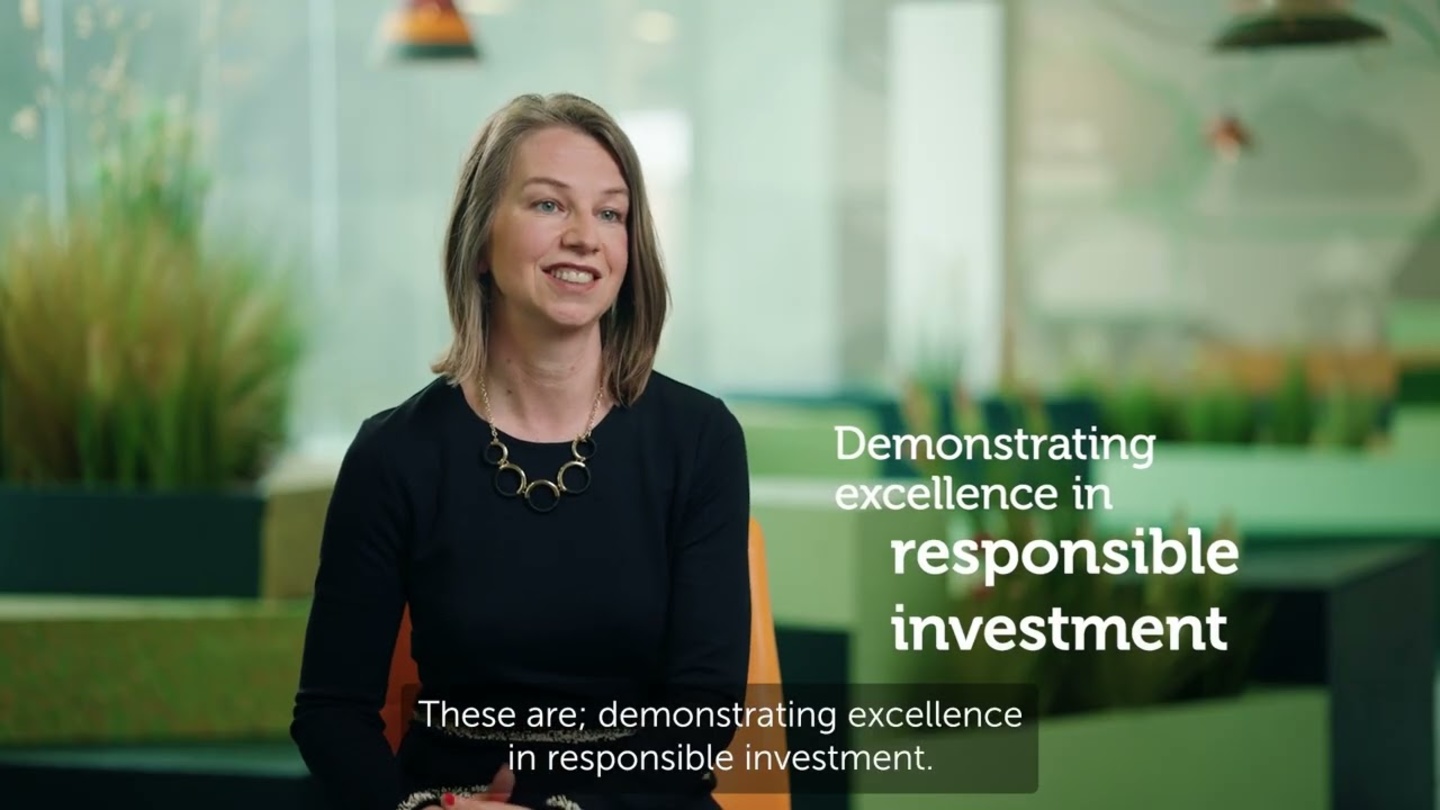
03 Pension Protection Fund Climate Change Report 2022/23 Introduction from our Chair Our work at the PPF has a We have always been guided by the principle • Demonstrating excellence in responsible investment that investing responsibly is critical to ensuring • Ensuring e昀昀ective stakeholder engagement with real impact on people’s sustainable returns for our stakeholders. For this integrity and respect reason, responsible investment has remained central lives. We believe embedding to how we manage our investment portfolio. We also • Championing collaboration and leading by example believe that placing sustainability at the heart of our • Being accountable for minimising our own sustainability in all of our activities is key to mitigating some of the material environmental impacts. ESG risks we face as an organisation. We have set ourselves high standards on climate activities and decisions will One of the four priorities of our Strategic Plan is change and responsible investment. Our target is to ‘Making a di昀昀erence’. As a public body, we’re in reach Net Zero for our operations by 2035 or sooner. bene昀椀t our members, levy a unique position. We want to share what we’re For our investments, we seek to contribute to the learning with others, and we want to catalyse the global transition to Net Zero through our portfolio payers, employees and our growth of a more sustainable pensions industry. and engagement activities. Our ambition is to make a di昀昀erence using our local communities alike. in昀氀uence in the pensions industry and in our The integrity of our commitments matters a great local communities. deal to us. Our sustainability goals will be re昀氀ected We were very proud to be named Best UK Pension Fund as a in every part of life at the PPF, from investment joint winner at the IPE Awards in December 2022. The judges As part of this, we have developed a holistic decisions and engaging with our stakeholders, highlighted the PPF’s ‘steady performance, with Environmental, sustainability strategy that builds on our established through to recruitment and the selection of Social and Governance at the heart of our investment strategy’. responsible investment strategy, our Diversity and our suppliers. We are proud to share our update This win recognises our e昀昀orts to be a leading responsible Inclusion strategy, and our Community Impact for this year. investor and the progress we have made to improve access to plan. We’ve drawn upon our organisational values, Kate Jones ESG-related data, advance ESG practices among our external the Five Capitals framework for sustainability, and Chair managers and support opportunities to deploy capital for an assessment of our material ESG risks, to identify positive social and environmental impact. four key sustainability goals: Pension Protection Fund
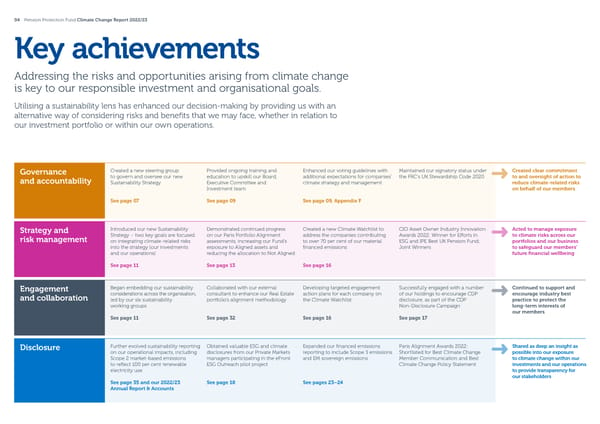
04 Pension Protection Fund Climate Change Report 2022/23 Key achievements Addressing the risks and opportunities arising from climate change is key to our responsible investment and organisational goals. Utilising a sustainability lens has enhanced our decision-making by providing us with an alternative way of considering risks and bene昀椀ts that we may face, whether in relation to our investment portfolio or within our own operations. Governance Created a new steering group Provided ongoing training and Enhanced our voting guidelines with Maintained our signatory status under Created clear commitment and accountability to govern and oversee our new education to upskill our Board, additional expectations for companies’ the FRC’s UK Stewardship Code 2020 to and oversight of action to Sustainability Strategy Executive Committee and climate strategy and management reduce climate-related risks Investment team on behalf of our members See page 07 See page 09 See page 09, Appendix F Strategy and Introduced our new Sustainability Demonstrated continued progress Created a new Climate Watchlist to CIO Asset Owner Industry Innovation Acted to manage exposure risk management Strategy – two key goals are focused on our Paris Portfolio Alignment address the companies contributing Awards 2022: Winner for E昀昀orts in to climate risks across our on integrating climate-related risks assessments, increasing our Fund’s to over 70 per cent of our material ESG and IPE Best UK Pension Fund; portfolios and our business into the strategy (our investments exposure to Aligned assets and 昀椀nanced emissions Joint Winners to safeguard our members’ and our operations) reducing the allocation to Not Aligned future 昀椀nancial wellbeing See page 11 See page 13 See page 16 Engagement Began embedding our sustainability Collaborated with our external Developing targeted engagement Successfully engaged with a number Continued to support and and collaboration considerations across the organisation, consultant to enhance our Real Estate action plans for each company on of our holdings to encourage CDP encourage industry best led by our six sustainability portfolio’s alignment methodology the Climate Watchlist disclosure, as part of the CDP practice to protect the working groups Non-Disclosure Campaign long-term interests of our members See page 11 See page 32 See page 16 See page 17 Disclosure Further evolved sustainability reporting Obtained valuable ESG and climate Expanded our 昀椀nanced emissions Paris Alignment Awards 2022: Shared as deep an insight as on our operational impacts, including disclosures from our Private Markets reporting to include Scope 3 emissions Shortlisted for Best Climate Change possible into our exposure Scope 2 market-based emissions managers participating in the eFront and EM sovereign emissions Member Communication and Best to climate change within our to re昀氀ect 100 per cent renewable ESG Outreach pilot project Climate Change Policy Statement investments and our operations electricity use to provide transparency for our stakeholders See page 35 and our 2022/23 See page 18 See pages 23–24 Annual Report & Accounts
This is a modal window.
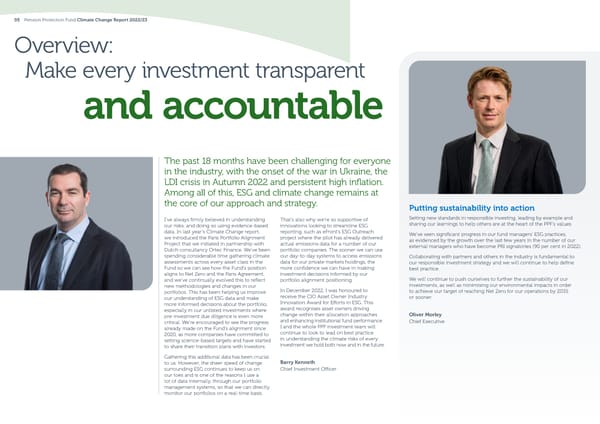
05 Pension Protection Fund Climate Change Report 2022/23 Overview: Make every investment transparent and accountable The past 18 months have been challenging for everyone in the industry, with the onset of the war in Ukraine, the LDI crisis in Autumn 2022 and persistent high in昀氀ation. Among all of this, ESG and climate change remains at the core of our approach and strategy. Putting sustainability into action I’ve always 昀椀rmly believed in understanding That’s also why we’re so supportive of Setting new standards in responsible investing, leading by example and our risks, and doing so using evidence-based innovations looking to streamline ESG sharing our learnings to help others are at the heart of the PPF’s values. data. In last year’s Climate Change report, reporting, such as eFront’s ESG Outreach We’ve seen signi昀椀cant progress in our fund managers’ ESG practices, we introduced the Paris Portfolio Alignment project where the pilot has already delivered as evidenced by the growth over the last few years in the number of our Project that we initiated in partnership with actual emissions data for a number of our external managers who have become PRI signatories (90 per cent in 2022). Dutch consultancy Ortec Finance. We’ve been portfolio companies. The sooner we can use spending considerable time gathering climate our day-to-day systems to access emissions Collaborating with partners and others in the industry is fundamental to assessments across every asset class in the data for our private markets holdings, the our responsible investment strategy and we will continue to help de昀椀ne Fund so we can see how the Fund’s position more con昀椀dence we can have in making best practice. aligns to Net Zero and the Paris Agreement, investment decisions informed by our and we’ve continually evolved this to re昀氀ect portfolio alignment positioning. We will continue to push ourselves to further the sustainability of our new methodologies and changes in our investments, as well as minimising our environmental impacts in order portfolios. This has been helping us improve In December 2022, I was honoured to to achieve our target of reaching Net Zero for our operations by 2035 our understanding of ESG data and make receive the CIO Asset Owner Industry or sooner. more informed decisions about the portfolio, Innovation Award for E昀昀orts in ESG. This especially in our unlisted investments where award recognises asset owners driving pre-investment due diligence is even more change within their allocation approaches Oliver Morley critical. We’re encouraged to see the progress and enhancing institutional fund performance. Chief Executive already made on the Fund’s alignment since I and the whole PPF investment team will 2020, as more companies have committed to continue to look to lead on best practice setting science-based targets and have started in understanding the climate risks of every to share their transition plans with investors. investment we hold both now and in the future. Gathering this additional data has been crucial to us. However, the sheer speed of change Barry Kenneth surrounding ESG continues to keep us on Chief Investment O昀케cer our toes and is one of the reasons I use a lot of data internally, through our portfolio management systems, so that we can directly monitor our portfolios on a real-time basis.
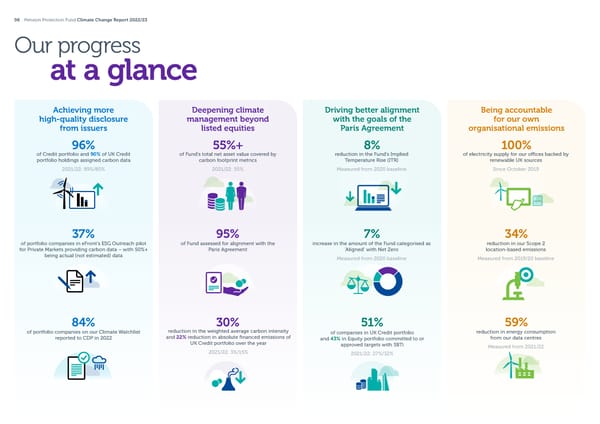
06 Pension Protection Fund Climate Change Report 2022/23 Our progress at a glance Achieving more Deepening climate Driving better alignment Being accountable high-quality disclosure management beyond with the goals of the for our own from issuers listed equities Paris Agreement organisational emissions 96% 55%+ 8% 100% of Credit portfolio and 90% of UK Credit of Fund’s total net asset value covered by reduction in the Fund’s Implied of electricity supply for our o昀케ces backed by portfolio holdings assigned carbon data carbon footprint metrics Temperature Rise (ITR) renewable UK sources 2021/22: 89%/80% 2021/22: 55% Measured from 2020 baseline Since October 2019 37% 95% 7% 34% of portfolio companies in eFront’s ESG Outreach pilot of Fund assessed for alignment with the increase in the amount of the Fund categorised as reduction in our Scope 2 for Private Markets providing carbon data – with 50%+ Paris Agreement ‘Aligned’ with Net Zero location-based emissions being actual (not estimated) data Measured from 2020 baseline Measured from 2019/20 baseline 84% 30% 51% 59% of portfolio companies on our Climate Watchlist reduction in the weighted average carbon intensity of companies in UK Credit portfolio reduction in energy consumption reported to CDP in 2022 and 22% reduction in absolute 昀椀nanced emissions of and 43% in Equity portfolio committed to or from our data centres UK Credit portfolio over the year approved targets with SBTi Measured from 2021/22 2021/22: 3%/15% 2021/22: 27%/32%
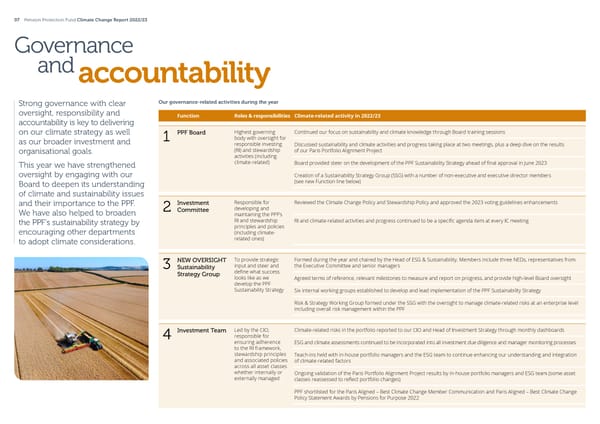
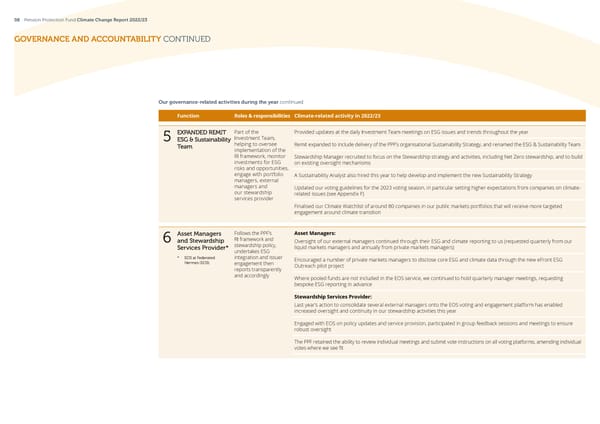
07 Pension Protection Fund Climate Change Report 2022/23 Governance andaccountability Strong governance with clear Our governance-related activities during the year oversight, responsibility and Function Roles & responsibilities Climate-related activity in 2022/23 accountability is key to delivering on our climate strategy as well PPF Board Highest governing Continued our focus on sustainability and climate knowledge through Board training sessions as our broader investment and 1 body with oversight for responsible investing Discussed sustainability and climate activities and progress taking place at two meetings, plus a deep dive on the results (RI) and stewardship organisational goals. of our Paris Portfolio Alignment Project activities (including climate-related) This year we have strengthened Board provided steer on the development of the PPF Sustainability Strategy ahead of 昀椀nal approval in June 2023 oversight by engaging with our Creation of a Sustainability Strategy Group (SSG) with a number of non-executive and executive director members Board to deepen its understanding (see new Function line below) of climate and sustainability issues and their importance to the PPF. Investment Responsible for Reviewed the Climate Change Policy and Stewardship Policy and approved the 2023 voting guidelines enhancements We have also helped to broaden 2 Committee developing and maintaining the PPF’s RI and stewardship the PPF’s sustainability strategy by RI and climate-related activities and progress continued to be a speci昀椀c agenda item at every IC meeting principles and policies encouraging other departments (including climate- to adopt climate considerations. related ones) NEW OVERSIGHT To provide strategic Formed during the year and chaired by the Head of ESG & Sustainability. Members include three NEDs, representatives from 3 Sustainability input and steer and the Executive Committee and senior managers Strategy Group de昀椀ne what success looks like as we Agreed terms of reference, relevant milestones to measure and report on progress, and provide high-level Board oversight develop the PPF Sustainability Strategy Six internal working groups established to develop and lead implementation of the PPF Sustainability Strategy Risk & Strategy Working Group formed under the SSG with the oversight to manage climate-related risks at an enterprise level including overall risk management within the PPF Investment Team Led by the CIO, Climate-related risks in the portfolio reported to our CIO and Head of Investment Strategy through monthly dashboards 4 responsible for ensuring adherence ESG and climate assessments continued to be incorporated into all investment due diligence and manager monitoring processes to the RI framework, stewardship principles Teach-ins held with in-house portfolio managers and the ESG team to continue enhancing our understanding and integration and associated policies of climate-related factors across all asset classes whether internally or Ongoing validation of the Paris Portfolio Alignment Project results by in-house portfolio managers and ESG team (some asset externally managed classes reassessed to re昀氀ect portfolio changes) PPF shortlisted for the Paris Aligned – Best Climate Change Member Communication and Paris Aligned – Best Climate Change Policy Statement Awards by Pensions for Purpose 2022
08 Pension Protection Fund Climate Change Report 2022/23 GOVERNANCE AND ACCOUNTABILITY CONTINUED Our governance-related activities during the year continued Function Roles & responsibilities Climate-related activity in 2022/23 EXPANDED REMIT Part of the Provided updates at the daily Investment Team meetings on ESG issues and trends throughout the year 5 ESG & Sustainability Investment Team, helping to oversee Team Remit expanded to include delivery of the PPF’s organisational Sustainability Strategy, and renamed the ESG & Sustainability Team implementation of the RI framework, monitor Stewardship Manager recruited to focus on the Stewardship strategy and activities, including Net Zero stewardship, and to build investments for ESG on existing oversight mechanisms risks and opportunities, engage with portfolio A Sustainability Analyst also hired this year to help develop and implement the new Sustainability Strategy managers, external managers and Updated our voting guidelines for the 2023 voting season, in particular setting higher expectations from companies on climate- our stewardship related issues (see Appendix F) services provider Finalised our Climate Watchlist of around 80 companies in our public markets portfolios that will receive more targeted engagement around climate transition Asset Managers Follows the PPF’s Asset Managers: 6 and Stewardship RI framework and Oversight of our external managers continued through their ESG and climate reporting to us (requested quarterly from our stewardship policy, Services Provider* liquid markets managers and annually from private markets managers) undertakes ESG * EOS at Federated integration and issuer Hermes (EOS). engagement then Encouraged a number of private markets managers to disclose core ESG and climate data through the new eFront ESG reports transparently Outreach pilot project and accordingly Where pooled funds are not included in the EOS service, we continued to hold quarterly manager meetings, requesting bespoke ESG reporting in advance Stewardship Services Provider: Last year’s action to consolidate several external managers onto the EOS voting and engagement platform has enabled increased oversight and continuity in our stewardship activities this year Engaged with EOS on policy updates and service provision, participated in group feedback sessions and meetings to ensure robust oversight The PPF retained the ability to review individual meetings and submit vote instructions on all voting platforms, amending individual votes where we see 昀椀t
This is a modal window.
09 Pension Protection Fund Climate Change Report 2022/23 GOVERNANCE AND ACCOUNTABILITY CONTINUED Climate and sustainability training • Climate Action 100+ Net Zero Benchmark constituents where companies have no medium-term targets in place Board ESG credentials Next steps A key governance aim this year was to build internal • Companies expanding coal-昀椀red infrastructure or that knowledge and understanding at the PPF of sustainability, have signi昀椀cant dependence on coal without a su昀케ciently The composition of the PPF Board has always Further training will include improving carbon and especially climate, issues through training and education. ambitious timeline and strategy for coal phase-out been crucial in stewarding value creation while literacy for PPF employees more widely, and a deep Two external speakers were invited to speak to the PPF • For deforestation, companies that score low on the also managing ESG risks. We have a Board member dive on o昀昀setting carbon emissions. Board about their experience and insights, followed by a Forest 500 rankings. with particular ESG expertise, who is also one of panel discussion and Q&A. One speaker gave an overview the members of our Sustainability Strategy Group. We will de昀椀ne more interim targets for the See Appendix F Sustainability Strategy and move into an from a non-昀椀nancial services perspective and the other for our full voting guidelines policy update. The PPF Board is proactive and regularly updated focused on how a listed asset manager is approaching by the ESG & Sustainability Team on the latest implementation phase. sustainability and its commitment to supporting Net Zero. In-house additional review process developments and thinking in ESG, sustainability For UK and other European companies, we now review and climate risk management. A Board strategy away-day included deep-dive interactive any shareholder proposals related to climate change workshops covering ESG materiality assessments, Net Zero internally. Shareholder meetings at companies on our target setting, and communicating sustainability issues to Climate Watchlist are also reviewed internally by the ESG & all stakeholders. Sustainability Team. Both steps will allow additional analysis Our approach to Responsible Investment (RI) and stewardship Upskilling of the Investment team on climate has continued around the progress being made against our internally-set throughout the year. The ESG team presented the results targets. A vote against management may be necessary if Our RI framework puts our core beliefs into practice: of the Paris Portfolio Alignment Project, including baseline we consider there has been inadequate progress on climate and subsequent progress. Executive Committee and Board strategy and management. members were also invited to attend. RI Framework Sustainability Strategy Enhancing voting guidelines accountability Strategic and oversight Governance & direction Risk Metrics & This year saw the publication of the PPF Sustainability accountability & policy management transparency In order to measurably track and encourage progress on Strategy, another critical development to help ensure the climate action, we use the Transition Pathway Initiative’s Fund’s longevity, enable us to lead by example and catalyse Management Quality assessment of companies (TPIMQ). the growth of a more sustainable pensions industry. Priorities We are also informed by the Climate Action 100+ Net Zero The Sustainability Strategy is a result of collaborative e昀昀orts, Company Benchmark and guided in our voting by industry starting at PPF Board level and cascading down to internal initiatives around Net Zero alignment for both asset owners Sustainability Working Groups. We have established a and our asset managers. clear line of leadership and accountability for developing, For 2023 voting decisions, we increased the TPIMQ delivering and evaluating the strategy. Climate Change Stewardship Reporting score thresholds for climate-related voting guidelines, This gives the PPF Board ultimate oversight with the authority particularly for: to approve and amend the strategy as deemed necessary. • European and Australian companies in speci昀椀c sectors As detailed in the panel on page 07, a Sustainability Strategy Climate & sustainability Engaging with (coal, oil, gas, utilities and autos) Group (SSG) has been created to steer development of the policies & strategies fund managers Internal ESG dashboards strategy and de昀椀ne what success looks like. Climate stewardship Engaging with issuers Investment Committee & Board reporting Climate risk assessments Voting of shares External RI reporting & sustainability reporting Climate Collaborative engagement External climate reporting opportunities & public policy
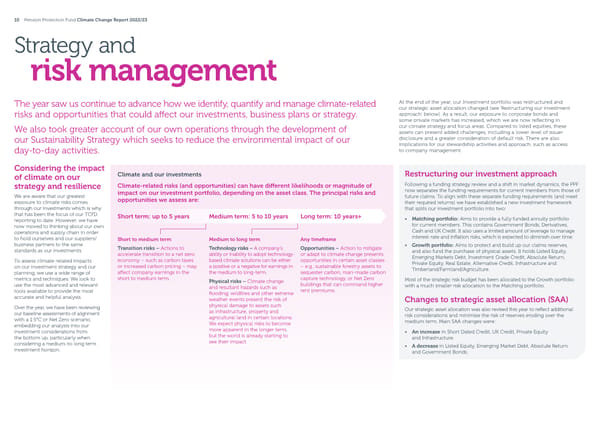
10 Pension Protection Fund Climate Change Report 2022/23 Strategy and risk management The year saw us continue to advance how we identify, quantify and manage climate-related At the end of the year, our Investment portfolio was restructured and our strategic asset allocation changed (see ‘Restructuring our investment risks and opportunities that could a昀昀ect our investments, business plans or strategy. approach’ below). As a result, our exposure to corporate bonds and some private markets has increased, which we are now re昀氀ecting in We also took greater account of our own operations through the development of our climate strategy and focus areas. Compared to listed equities, these assets can present added challenges, including a lower level of issuer our Sustainability Strategy which seeks to reduce the environmental impact of our disclosure and a greater consideration of default risk. There are also implications for our stewardship activities and approach, such as access day-to-day activities. to company management. Considering the impact of climate on our Climate and our investments Restructuring our investment approach strategy and resilience Climate-related risks (and opportunities) can have di昀昀erent likelihoods or magnitude of Following a funding strategy review and a shift in market dynamics, the PPF impact on our investment portfolio, depending on the asset class. The principal risks and now separates the funding requirements for current members from those of We are aware that our greatest opportunities we assess are: future claims. To align with these separate funding requirements (and meet exposure to climate risks comes their required returns) we have established a new investment framework through our investments which is why that splits our investment portfolio into two: that has been the focus of our TCFD Short term: up to 5 years Medium term: 5 to 10 years Long term: 10 years+ reporting to date. However, we have • Matching portfolio: Aims to provide a fully funded annuity portfolio now moved to thinking about our own for current members. This contains Government Bonds, Derivatives, operations and supply chain in order Cash and UK Credit. It also uses a limited amount of leverage to manage to hold ourselves and our suppliers/ Short to medium term Medium to long term Any timeframe interest-rate and in昀氀ation risks, which is expected to diminish over time. business partners to the same Transition risks – Actions to Technology risks – A company’s Opportunities – Action to mitigate • Growth portfolio: Aims to protect and build up our claims reserves, standards as our investments. accelerate transition to a net zero ability or inability to adopt technology- or adapt to climate change presents and also fund the purchase of physical assets. It holds Listed Equity, To assess climate-related impacts economy – such as carbon taxes based climate solutions can be either opportunities in certain asset classes Emerging Markets Debt, Investment Grade Credit, Absolute Return, on our investment strategy and our or increased carbon pricing – may a positive or a negative for earnings in –e.g., sustainable forestry assets to Private Equity, Real Estate, Alternative Credit, Infrastructure and planning, we use a wide range of a昀昀ect company earnings in the the medium to long-term. sequester carbon, man-made carbon Timberland/Farmland/Agriculture. metrics and techniques. We look to short to medium term. Physical risks – Climate change capture technology, or Net Zero Most of the strategic risk budget has been allocated to the Growth portfolio use the most advanced and relevant and resultant hazards such as buildings that can command higher with a much smaller risk allocation to the Matching portfolio. tools available to provide the most 昀氀ooding, wild昀椀res and other extreme rent premiums. accurate and helpful analysis. weather events present the risk of Changes to strategic asset allocation (SAA) Over the year, we have been reviewing physical damage to assets such Our strategic asset allocation was also revised this year to re昀氀ect additional our baseline assessments of alignment as infrastructure, property and risk considerations and minimise the risk of reserves eroding over the with a 1.5°C or Net Zero scenario, agricultural land in certain locations. medium term. Main SAA changes were: embedding our analysis into our We expect physical risks to become investment considerations from more apparent in the longer term, • An increase in Short Dated Credit, UK Credit, Private Equity the bottom up, particularly when but the world is already starting to and Infrastructure. considering a medium-to-long term see their impact. • A decrease in Listed Equity, Emerging Market Debt, Absolute Return investment horizon. and Government Bonds.
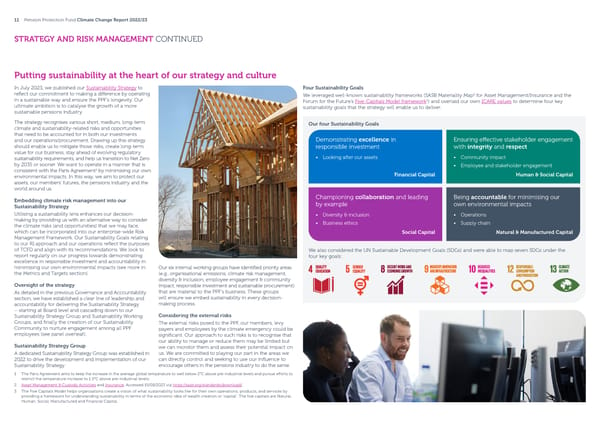
11 Pension Protection Fund Climate Change Report 2022/23 STRATEGY AND RISK MANAGEMENT CONTINUED Putting sustainability at the heart of our strategy and culture In July 2023, we published our Sustainability Strategy to Four Sustainability Goals re昀氀ect our commitment to making a di昀昀erence by operating 2 We leveraged well-known sustainability frameworks (SASB Materiality Map for Asset Management/Insurance and the in a sustainable way and ensure the PPF’s longevity. Our 3 Forum for the Future’s Five-Capitals Model framework ) and overlaid our own ICARE values to determine four key ultimate ambition is to catalyse the growth of a more sustainability goals that the strategy will enable us to deliver. sustainable pensions industry. The strategy recognises various short, medium, long-term Our four Sustainability Goals climate and sustainability-related risks and opportunities that need to be accounted for in both our investments and our operations/procurement. Drawing up this strategy Demonstrating excellence in Ensuring e昀昀ective stakeholder engagement should enable us to mitigate those risks, create long-term responsible investment with integrity and respect value for our business, stay ahead of evolving regulatory sustainability requirements, and help us transition to Net Zero • Looking after our assets • Community impact by 2035 or sooner. We want to operate in a manner that is • Employee and stakeholder engagement 1 consistent with the Paris Agreement by minimising our own Financial Capital Human & Social Capital environmental impacts. In this way, we aim to protect our assets, our members’ futures, the pensions industry and the world around us. Embedding climate risk management into our Championing collaboration and leading Being accountable for minimising our Sustainability Strategy by example own environmental impacts Utilising a sustainability lens enhances our decision- • Diversity & inclusion • Operations making by providing us with an alternative way to consider • Business ethics • Supply chain the climate risks (and opportunities) that we may face, which can be incorporated into our enterprise-wide Risk Social Capital Natural & Manufactured Capital Management Framework. Our Sustainability Goals relating to our RI approach and our operations re昀氀ect the purposes of TCFD and align with its recommendations. We look to We also considered the UN Sustainable Development Goals (SDGs) and were able to map seven SDGs under the report regularly on our progress towards demonstrating four key goals: excellence in responsible investment and accountability in minimising our own environmental impacts (see more in Our six internal working groups have identi昀椀ed priority areas the Metrics and Targets section). (e.g., organisational emissions, climate risk management, diversity & inclusion, employee engagement & community Oversight of the strategy impact, responsible investment and sustainable procurement) As detailed in the previous Governance and Accountability that are material to the PPF’s business. These groups section, we have established a clear line of leadership and will ensure we embed sustainability in every decision- accountability for delivering the Sustainability Strategy making process. –starting at Board level and cascading down to our Sustainability Strategy Group and Sustainability Working Considering the external risks Groups, and 昀椀nally the creation of our Sustainability The external risks posed to the PPF, our members, levy Community to nurture engagement among all PPF payers and employees by the climate emergency could be employees (see panel overleaf). signi昀椀cant. Our approach to such risks is to recognise that our ability to manage or reduce them may be limited but Sustainability Strategy Group we can monitor them and assess their potential impact on A dedicated Sustainability Strategy Group was established in us. We are committed to playing our part in the areas we 2022 to drive the development and implementation of our can directly control and seeking to use our in昀氀uence to Sustainability Strategy. encourage others in the pensions industry to do the same. 1 The Paris Agreement aims to keep the increase in the average global temperature to well below 2°C above pre-industrial levels and pursue e昀昀orts to restrict the temperature increase to 1.5°C above pre-industrial levels. 2 Asset Management & Custody Activities and Insurance. Accessed 15/08/2023 via https://sasb.org/standards/download/. 3 The Five Capitals Model helps organisations create a vision of what sustainability looks like for their own operations, products, and services by providing a framework for understanding sustainability in terms of the economic idea of wealth creation or ‘capital’. The 昀椀ve capitals are Natural, Human, Social, Manufactured and Financial Capital.
12 Pension Protection Fund Climate Change Report 2022/23 STRATEGY AND RISK MANAGEMENT CONTINUED Our Sustainability Community Next steps To support our Sustainability Goal ‘Ensuring e昀昀ective stakeholder engagement Employees are able to post their thoughts on various signi昀椀cant days – such with integrity and respect’, we established a Sustainability Community as World Environment Day and Earth Day – and receive/share tips on making We will develop a Climate Change networking hub on the PPF’s intranet this year. Open to all PPF employees, the a positive environmental impact (e.g., using reusable co昀昀ee cups, sharing Adaptation Plan, which will assess Hub aims to inspire and educate on the values and importance of sustainability experience of installing solar panels or buying an electric vehicle.) the potential impact of physical both in the PPF and the broader community. PPF employees are encouraged risks of climate change on our to share their ideas and suggestions to minimise their environmental impacts. operations and our resilience to these risks (long term as well as acute). We have started to carry out climate-change stress tests in our Long-Term Risk Model, which we use to model potential future scenarios for our liabilities, including stress-testing the impact on the PPF’s own balance sheet. Sustainability is about impact – on society, our communities and the environment. Together, we can make a real di昀昀erence to people’s lives.
13 Pension Protection Fund Climate Change Report 2022/23 STRATEGY AND RISK MANAGEMENT CONTINUED CASE STUDY Progressing our Work continued throughout this year to refresh our assessments in the Equity, Credit and Real Estate asset Paris Portfolio Alignment Project classes that saw turnover or allocation changes. We can now track how our portfolio alignment has progressed across a number of time periods, and we have already seen Last year we reported on our innovative project to assess the implied good progress. For example, we have seen the percentage temperature rise (ITR) of our portfolio relative to the goals of the 2015 PPF Fund Paris Alignment of the Fund categorised as ‘Not Aligned’ decline by 11 per cent while the percentage classi昀椀ed as ‘Aligned’ increased Paris Agreement. Subsequent analysis has helped us become better +7% -11% by 7 per cent between December 2020 and 2022. informed about our position and how di昀昀erent parts of our portfolio The main driver for the declining allocation to ‘Not Aligned’ might be contributing to climate change. Dec-22 is down to the exponential success of the Science-Based Targets initiative (SBTi), which has nudged many companies up to the ‘Committed to Align’ bucket. In 2020, there were Initiated in early 2021, the Paris Portfolio Alignment ITR for PPF portfolio 2020–2022 918 companies signed up to the SBTi, of which 495 had Project aims to help us: Dec-21 approved targets. By May 2023, this had grown to 5,309 companies. See more in Metrics and Targets. • Understand where – if business were to continue 2.6 as usual – our investment portfolio stands from a 2.5 -8% Strengthening our decarbonisation approach bottom-up perspective in terms of alignment with the 2.4 Dec-20 The Paris Portfolio Alignment Project has enabled us to set Paris Agreement 2.3 a more con昀椀dent direction for decarbonising our portfolio • Develop methodologies for 昀椀lling gaps in asset classes than if we had only set a top-down target – for example – especially among private companies – and try-and- 2.2 0% 10% 20% 30% 40% 50% 60% 70% 80% 90% 100% feeding into the creation of our Climate Watchlist (see test the emerging methodologies 2.1 Net Zero Aligned page 16). It has also allowed us to contribute directly to 2.0 advancing the measurement and management of climate • Assess ITR contributions by all asset classes in order to Committed to Align/Aligning Not Aligned risk using a Paris alignment lens, and identi昀椀ed where identify speci昀椀c companies/assets that are misaligned 1.9 Insufficient data Not included we and our peers need to push for improvements in • Develop engagement strategies for the largest 1.8 alignment data and reporting. contributors to climate change to improve their 1.7 alignment, or consider escalation options, while still How we have categorised our alignment assessments: focusing on meeting our investment objectives. 1.6 Net Zero: Assets already achieving net zero emissions Next steps 1.5 Aligned: Assets with ITR score of 1.5°C or lower; Progress on the PPF ITR score Dec-20 Dec-21 Dec-22 assets with carbon performance aligned with their Each desk within our Investment team has We reported the high-level ITR 昀椀ndings of the 2020 sector Net Zero pathway designated areas of focus for the next year to drive baseline assessment in our 2021/22 report, which showed Categorising assets by alignment further improvement in alignment with the goals of the Fund was on a 2.5°C global warming trajectory. The ITR score is useful in allowing us to aggregate the Committed to align/aligning: Assets with ITR score the Paris Agreement. In summary: di昀昀erent asset classes to give an overall Fund assessment, between 1.5 and 2°C; companies with approved Our December 2022 update indicates the Fund’s ITR but it is more limited in understanding the progress of SBTi target or target set; countries with a Net Zero • For Liquids Markets where data availability score has reduced to 2.3°C (see chart), driven largely alignment. Therefore, we have spent a lot of time further commitment or NDCs ‘almost su昀케cient’ and coverage of ITR/SBTi is greater, action is by improvements in our Equities, Corporate Credit classifying the portfolio (by asset class) into alignment Not aligned: Assets with ITR score over 2°C and no centred around our new Climate Watchlist of and Real Estate books. categories, informed largely by the IIGCC’s Net Zero SBTi target companies requiring targeted engagement on Investment Framework. Insu昀케cient data: Assets that we are unable to model climate transition Not included: Assets or asset classes considered • For Private Markets, the alignment project out-of-scope for the project has emphasised the need for portfolio company disclosure so we can start validating Note: The PPF ESG team’s in-house assessments based on Ortec proxies and replace them with real data. See 2020 and 2021 results, MSCI ITR 2022 analysis, SBTi approved more about how we are progressing this on targets and countries’ targets. Alignment categories are leveraged page 18. from the IIGCC Net Zero Investment Framework.
14 Pension Protection Fund Climate Change Report 2022/23 STRATEGY AND RISK MANAGEMENT CONTINUED How we assess the risks and opportunities Progress on Climate scenario analysis Our climate transition scenarios Our external data provider, MSCI, has updated its overall Climate Value At Risk When stress-testing the Climate Value at Risk (Climate VaR) of our (VaR) models by incorporating a number of improvements. This does mean portfolios, we take into account a number of climate transition scenarios that we cannot directly compare this year’s results with last year’s due to the that align with those developed by the Network for Greening the Financial signi昀椀cant number of enhancements: System (NGFS): • Improvements in physical risk analysis: Physical risk analysis has been Our scenario category Equivalent NGFS scenario expanded. Speci昀椀cally, MSCI now includes two new datasets, Regional Company Exposure to Physical Hazards and Regional Physical Hazard 1.5 degrees orderly Net Zero 2050 (1.5°C) Metrics, which aligns with TCFD recommendations. 1.5 degrees disorderly Divergent Net Zero (1.5°C) • Reduction in the Transition Climate VaR time horizon from 2100 to 2050: This is a welcome change given the global focus on achieving Net Zero 2 degrees orderly Below 2°C 2 degrees disorderly Delayed transition by 2050. • Re昀椀nement of assumptions for the Technology Opportunity model: Hot house world Current policies Calculations of low-carbon revenues for each company have been enhanced and the projected electricity generation fuel mix now re昀氀ects each climate transition scenario. (Previously, the projected electricity generation fuel mix NGFS scenarios framework was based on IEA data that was aligned with a speci昀椀c temperature but was not scenario speci昀椀c, i.e. ignored whether the transition would be orderly gh or disorderly.) i H Disorderly Too little, too late The chart below shows the impact of the worst transition risk scenario and the worst physical risk impact on each of our Liquids portfolios. For all three portfolios, it is the same scenarios that are the most disruptive i.e., 1.5 degrees disorderly/Divergent Net Zero combined with aggressive physical risk impacts. The Credit and UK Credit portfolios are found to demonstrate more resilience Divergent to both physical and transition risks than the Equities portfolio, based on the Net Zero VaR outputs. (1.5ºC) See our detailed Climate VaR results in the Metrics & Targets section. Delayed Climate VaR quick overview relative to our portfolios Enhancements to external manager ESG reporting transition s There have been no signi昀椀cant changes to our quarterly ESG reporting template k is 30% for our Liquids managers which is now very comprehensive and has led to an r n improvement in the quality of reporting, especially on climate risks. We continue o iti 25% $2.98bn to look to improve the depth and comparability of ESG reporting among our ns external managers, with progress on the reporting of alternative assets: a r T R Net Zero a • Real Estate: Our annual reporting template seeks to encourage V 20% 2050 (1.5ºC) l a $1.77bn standardisation and requires managers to include energy ratings and c i s y performance certi昀椀cates. h P 15% e • Farmland and Timberland: We started asking for additional data in 2020 to Below 2ºC v i s $4.62bn enable more accurate and standardised alignment and carbon sequestration NDCs es10% gr assessments, although this is still a work in progress while managers use Current Ag di昀昀erent sequestration methodologies. policies 5% • Private Markets: The eFront ESG Outreach Project has expanded coverage this year to include all Private Markets. One caveat is that the current 0% questionnaire does not di昀昀erentiate between companies and real assets, w Orderly Hot house world 0% 2% 4% 6% 8% 10% 12% 14% 16% 18% 20% which we raised with the Outreach team. Lo Highest Transition VaR Low Physical risks High Equities Credit UK Credit
15 Pension Protection Fund Climate Change Report 2022/23 STRATEGY AND RISK MANAGEMENT CONTINUED Summary of our processes and tools for assessing climate risks across asset classes The table, right, summarises the METRIC/PORTFOLIO COVERAGE ASSET CLASSES COVERED WHAT IS MEASURED progress made over the year to measure our climate-related risks in each asset class, through a range Absolute carbon emissions apportioned (using EVIC) to PPF’s holdings (tonnes CO e) Carbon emissions 2 of tools and metrics. 55% of total PPF portfolio This year we have indicated the value covered Equities, Credit, UK Credit, Relative carbon intensity apportioned (using EVIC) to PPF’s holdings, normalised by percentage of the PPF portfolio that Sovereign Debt amount invested (tonnes CO2e/USDm) can currently be assessed per metric. Weighted average carbon intensity of PPF’s holdings, normalised by revenues (corporates) or PPP-GDP (sovereign), (tonnes CO2e/USDm) Real Assets Work in progress Climate Value-at-Risk Transition risks – policy risk costs, technology opportunities (% of Enterprise Value) (Climate VaR) Equities, Credit, UK Credit Physical risks (% of Enterprise Value) 55% of total PPF portfolio value covered Sovereign Debt Climate VaR metrics – work in progress Portfolio alignment • % of portfolio companies committed to the Science Based Targets initiative (SBTi) 95% of total PPF portfolio All asset classes or other science-based targets value covered • Implied Temperature Rise, expressed in °C (by 2100) Sustainability exposure* Equities Green revenues/exposure to companies classi昀椀ed as low-carbon solutions 63% of total PPF portfolio value covered Credit (sovereign & corporate) Green Bonds, Social Bonds, Sustainability Bonds and Sustainability Linked Bonds * See our classi昀椀cation of ‘sustainable’ investments on page 33. Real Estate High Quality Standard Certi昀椀cation/High Energy Rating Private Assets (work in progress) Renewable Energy, Forestry, assets classi昀椀ed as green opportunities by internal/ external manager
16 Pension Protection Fund Climate Change Report 2022/23 STRATEGY AND RISK MANAGEMENT CONTINUED How we manage the risks identi昀椀ed Considering the positioning During the year, we continued to CASE STUDY of our portfolios re昀氀ect the Institutional Investors Group The move to our climate-aware on Climate Change (IIGCC)’s Net Creating our Climate Watchlist equity benchmark, as reported in our Zero Stewardship Toolkit in our own Climate Change Report 2022, has been stewardship processes around climate This year, in line with the IIGCC’s Net Zero Stewardship Toolkit’s guidelines, instrumental in enabling us to improve risks. The toolkit aims to raise the bar we identi昀椀ed our Climate Watchlist: 87 companies in material sectors that our Equity portfolio’s emission pro昀椀le. for investor climate stewardship by collectively are responsible for over 70 per cent of the 昀椀nanced Scope 1 and 2 providing a systematic framework to emissions associated with our public markets investments. Our Equity passive mandates closely help investors prioritise high-impact track this benchmark. Additionally, we engagement while systematically Of these 87 companies – which are predominantly based in the US and Asia- use the information reported to us by ensuring they have measures in place Paci昀椀c – we are already engaging with 45 through the Climate Action 100+ our managers in our quarterly ESG to hold laggard companies to account. (CA100+) investor initiative. A further 22 are targeted for engagement by EOS, templates to review any material risks our Stewardship Services Provider. We are now identifying the best options for highlighted by them and compare these Establishing our voting guidelines engaging with the remainder, whether directly or through collaborations. against our own internal monitoring. on climate change This has allowed us to have much As mentioned in the previous section, more constructive discussions in our we updated our voting guidelines Our Net Zero engagement process manager review meetings, so we can during the year to integrate various understand their investment theses climate measures into our wider voting Undertake portfolio Achieve asset and potentially challenge them on strategy. This includes specifying alignment analysis, set Set Net Zero alignment Develop an owner and Establish a baseline their assumptions where necessary. some of the key escalation situations alignment goals and criteria, alignment engagement strategy manager alignment, engagement and The stewardship sections of our where we will consider voting against develop a stewardship levels and time bound for priority companies engagement and voting policy, and manager reporting template also management on issues including prioritisation framework engagement objectives transparency escalation approach provide us with more detail on how climate change. our managers are engaging with issuers We are reviewing all companies on or policymakers, and highlight progress our Climate Watchlist held by our Breakdown of Climate Watchlist engagement In addition to engagement, we have recently formalised an escalation made, or speci昀椀c escalations taken. external managers to ensure voting strategy for the Climate Watchlist that can be deployed when engagements Stewardship and engagement continuity where appropriate. The are either failing or progressing too slowly. Financed emissions analysis of Climate Action 100+ initiative (see 70%+ 昀椀nanced the PPF portfolio will be undertaken at least annually to ensure our Climate We engage extensively with all our page 17) highlights resolutions of emissions* – Watchlist always holds the most relevant names. external managers to encourage interest to members, alerting us to key 87 companies ongoing improvement in their proposals to take into consideration Our annual Responsible Investment report provides more detail on the approaches to managing climate during the voting season. We leverage stewardship activities and progress of EOS, our fund managers and any risks and ensure they continue to this list of resolutions as part of our EOS engagement direct or collaborative engagements we have carried out. This includes meet our standards in this area. Our oversight process. universe – activities related to climate issues. stewardship services provider EOS 22 companies prioritises climate risk and opportunity management in its engagement with issuers, which feeds into voting The creation of our Climate Watchlist is recommendations at company AGMs. a signi昀椀cant achievement, enabling us to hone CA100+ list: in on the companies that will have a real impact 45 companies on emissions reductions of the portfolio. Daniel Jarman * Using Scope 1+2 emissions. Stewardship Manager
17 Pension Protection Fund Climate Change Report 2022/23 STRATEGY AND RISK MANAGEMENT CONTINUED Industry collaboration We continue to participate in valuable CASE STUDY CASE STUDY climate-focused memberships and networks, such as the IIGCC and the Climate Action 100+ Supporting CDP ongoing Climate Action 100+ initiative. This year, the IIGCC launched a new The PPF is a signatory to Climate Action 100+, the largest- We continue to work closely with CDP, the global Net Zero Engagement Initiative (NZEI) ever investor engagement initiative on climate change, environmental disclosure organisation, on two to scale and accelerate climate-related involving around 700 investors who collectively hold half of corporate engagement. The new the world’s assets under management. Climate Action 100+ campaigns to encourage comprehensive and initiative aims to help investors align puts pressure on the world’s largest greenhouse gas emitters, more of their investment portfolio with which together account for approximately 80 per cent of global robust corporate disclosure on climate and the goals of the Paris Agreement by industrial emissions. 58 per cent of our 昀椀nanced emissions are environmental issues. extended focus beyond the companies attributed to Climate Action 100+ companies. on the Climate Action 100+ list. We A 2022 progress update found that, of 166 companies covered The 2022 CDP Non-Disclosure are leveraging the NZEI initiative to by the initiative: Campaign was fruitful overall, with further align collective engagement companies engaged in the campaign with our Climate Watchlist, which has • 92 per cent have some level of board oversight of material 2.3 times more likely to disclose than emerged from our own Paris Portfolio climate-related issues those that weren’t. Alignment Project. We are leading direct Non-Disclosure Campaign: engagement with one of the NZEI • 75 per cent of targeted companies have made Net Zero Science-Based Targets companies as part of the initiative. commitments (52 per cent in 2021) Again this year, we supported (SBT) Campaign: CDP’s annual campaign to engage The CDP Science-Based Targets The following three case studies • 91 per cent now report in line with TCFD recommendations with major companies that have (SBT) Campaign was launched in highlight the progress made over the (72 per cent in 2021). failed to respond to its climate October 2022, attracting support year for the key industry collaborations change, forestry and/or water from 318 昀椀nancial institutions and we’re involved with. Examples of recent progress seen in companies include: security questionnaires. multinational 昀椀rms, including the Eneos Holdings: The Japanese petroleum and metals company We elected to lead direct outreach PPF, representing $37 trillion in announced in May 2022 its plan to reduce Scope 1 and 2 emissions e昀昀orts with eight companies in assets and spending. The campaign 75 per cent of by 46 per cent by 2030 compared to 2013 and expand its Net Zero our portfolios. Three companies called on over 1,060 of the world’s ambition to cover Scope 3 emissions (Net Zero by 2050). submitted responses as a result highest-impact businesses to set targeted companies of this, directly bene昀椀ting the emissions goals in line with the Origin Energy: The Australian energy company made progress coverage of reported emissions Paris Agreement. in the CA100+ have on climate disclosures and commitments during the year, within our portfolios. For the names including the closure of its coal-昀椀red power stations seven years Last year’s 2022–2023 campaign made Net Zero earlier than previously announced and the inclusion of Scope 3 that declined to respond in 2022, resulted in 77 targeted companies, emissions in its long-term plans. we have re-elected to lead direct as of end-May 2023, joining commitments engagement again with these the ranks of 5,100+ companies Enel: The second-largest power company in the world, based companies in the 2023 campaign. committed to using science-based (52 per cent in 2021). in Italy, became the 昀椀rst company globally to ful昀椀l all its We have also used the lack of targets to align their business with disclosure obligations on the Climate Action 100+ Net Zero disclosure to inform our voting the Paris Agreement. They represent Company Benchmark. 0.2 gigatonnes in CO e emissions decisions at these speci昀椀c 2 Although the success of this initiative has been encouraging, companies, for example if a and $2.9 billion in market cap, there is a long way until companies achieve high-level shareholder resolution has been which is respectively 3 per cent performance across all indicators assessed by Climate Action 昀椀led to request this, or voting and 12 per cent of the 2022 CDP 100+. Lots more work needs to be done as the initiative moves against the audit committee in corporate database. into its second phase this year. more extreme circumstances. Read more about the PPF’s own exposure to companies using science-based targets on page 30.
18 Pension Protection Fund Climate Change Report 2022/23 STRATEGY AND RISK MANAGEMENT CONTINUED CASE STUDY eFront ESG Outreach project We have been closely involved in an ESG outreach project led by one of our data solution providers eFront (part of BlackRock) to address the lack of ESG and climate-related data and reporting from private companies. We joined the eFront ESG Outreach pilot project as In terms of emissions data reported for the PPF a limited partner (LP) in late-2021, working with a funds in the pilot: selection of private equity and credit general partners (GPs) managing funds with vintage years from 2015 to • 37 per cent of our portfolio companies reported collect relevant ESG and climate metrics on underlying GHG emissions data, of which just over half was portfolio companies. actual rather than estimated data We anticipate this initiative will go a long way to • The frequency of Scope 1 and 2 emissions disclosure improving the process for private market data collection, was much higher than Scope 3; only 25 per cent especially among smaller managers that haven’t yet built of companies reported on Scope 3 whether actual out their own reporting functionality. The ultimate aim or estimated (similar to public markets) is to open the product up to over 2,500 private market • eFront was also able to o昀昀er LPs the option to 昀椀ll managers, reaching over 70,000 private companies. some data gaps with higher-level sector estimates; With our encouragement, 60 per cent of our own as a result, emissions data (whether actual or managers that were contacted in the pilot phase reported estimated) was available for just over 90 per portfolio company data – four times higher than the cent of our portfolio companies in the funds that overall response rate. responded to the pilot. Next steps The 2023 update has been signi昀椀cantly expanded across the eFront platform and increased eightfold for PPF’s GPs. As part of the broader roll-out this year, it has been recognised that more education is needed among GPs to raise awareness of the regulation that LPs face in di昀昀erent jurisdictions and the timeframes for reporting.
19 Pension Protection Fund Climate Change Report 2022/23 Metrics and targets The increased reporting For another year, we can report advancement Year-on-year comparison of carbon emissions disclosure rates (by market value) on carbon emissions by in the breadth of climate-related disclosure 100% 1% 1% 2% 4% 昀椀xed income issuers is a 24% 18% 23% 27% 11% 7% 10% 20% 19% across asset classes, including new metrics 29% 44% 19% welcome result, giving us 80% 81% 15% 18% more comprehensive to report on our portfolio’s alignment with 75% 75% 72% 60% 69% 65% 63% data points. Paris Agreement temperature targets. 60% 40% 49% Corporates’ disclosure rates and 20% data quality 0 Good quality disclosure ensures that Additionally, a few of the new Equity 2022 2021 2020 2022 2021 2020 2022 2021 2020 our analysis of climate-related risks positions added to the portfolio Equities Credit UK Credit is as valuable and decision-useful during the year have a ‘lower’ quality Reported Estimated Not Covered as possible. We measure whether of emissions reporting than the carbon emissions are reported by positions being sold. Certain information ©2023 MSCI ESG Research LLC. Reproduced by permission; no further distribution. portfolio companies themselves, or if they need to be estimated by our More positively, less than 1 per cent of Year-on-year comparison of contributions to total carbon emissions by source of data ESG data provider, or are classi昀椀ed as our Equity holdings by market value not covered at all. We also look at the have no coverage at all – an all-time low. 100% 5% split between reported and estimated 17% 17% 25% 25% 38% 9% 8% 95% 6% The reported carbon emissions by 91% 92% 94% carbon emissions data but on a market value for global Credit and 80% 83% 83% weighted by emissions basis (rather UK Credit continue to show year- 75% 75% than just weighted by market value). on-year improvements, hitting 69 60% per cent and 72 per cent respectively. 62% This year’s assessment of reported emissions for our Equity holdings For the Credit book, this is due to 40% fell by around 5 per cent back to higher-quality emissions reporting for 2020 levels. This is primarily because existing positions, and new positions 20% of companies that had not reported in the portfolios having better quality their most recent emissions or disclosure than sold positions. provided insu昀케ciently complete 0 emissions data, so our external We are pleased to see a year-on-year 2022 2021 2020 2022 2021 2020 2022 2021 2020 provider had to apply estimates. halving in the percentage of UK Credit Equities Credit UK Credit assets by market value that are not Reported Estimated However, the overall percentage covered, from 20 per cent to 10 per of reported data based on the cent, helped by our data provider Certain information ©2023 MSCI ESG Research LLC. Reproduced by permission; no further distribution. contribution from carbon emissions increasing its coverage of 昀椀xed income Some 昀椀gures may add up to more than 100% due to rounding. has remained stable since last year, issuers. However, we can also see a fall with 83 per cent of the companies in the percentage of reported data for most responsible for the portfolio’s UK Credit based on the contribution footprint providing disclosure. from carbon emissions, which is something we will be monitoring.
20 Pension Protection Fund Climate Change Report 2022/23 METRICS AND TARGETS CONTINUED Asset class coverage The diversity of asset classes that we are invested in can Next steps of companies in our new make it challenging to report our 昀椀nanced emissions for the whole of our portfolio. We continue to footprint Public We are doing our best to achieve maximum Climate Watchlist reported Equity and Corporate Credit for the third year and UK emissions coverage for the public books, and it is 84% Sovereign Debt for the second year. We have also added an explicit part of our engagement strategy for our in the 2022 CDP annual initial assessments for Emerging Market Sovereign Debt Climate Watchlist. The coverage achieved so far for the 昀椀rst time. is reasonable but of course there is still room for disclosure questionnaire Our more recently added assessments for UK Sovereign improvement. We also continue to explore ways to Debt and EM Sovereign Debt both achieve 100 per cent meaningfully cover the remaining instrument types coverage thanks to good country-level coverage by our within our Liquids portfolios. data provider, although this asset class faces a more signi昀椀cant lagged data problem. This does mean that the carbon footprints for these portfolios are another year behind that of our corporate-based portfolios. This is another reason why we have chosen not to aggregate our corporate and sovereign emissions data. Methods for covering the outstanding instrument types that we have to consider out-of-scope in public markets are still not widely available. In particular, we still cannot assess: Derivatives (e.g., CDS and futures), certain funds with no portfolio look-through, and true Cash positions. We also exclude short positions. However, we have been able to include lookthrough-based assessments for the Equity ETFs (within the Equity passive book) and Municipals (within the Credit book) this year. As mentioned previously, getting coverage of companies in the Private Markets space has long been a signi昀椀cant challenge. However, we are now starting to see some emissions data materialising through the eFront ESG Outreach project for a selection of our private markets funds. Other initiatives such as the ESG Data Convergence Initiative (EDCI) have also seen strong fund participation over the past year, and eFront fully captures the EDCI metrics to allow GPs and portfolio companies to report to both frameworks in a standardised way.
21 Pension Protection Fund Climate Change Report 2022/23 METRICS AND TARGETS CONTINUED Absolute carbon emissions Again this year, we measured the total Scope 1 See Appendix D for more detail on the formulas used for and Scope 2 carbon emissions associated with our our calculations. UK and EM Sovereign Debt portfolios Reasons for fall in Equities’ absolute emissions Like last year, we have delved deeper into the liquid investments in global equity (‘Equities’), global are excluded from the absolute carbon emissions table; It’s important to note that absolute emissions for drivers causing the 57 per cent reduction in total investment grade and emerging market credit (‘Credit’) we report relative intensities only for sovereigns (in the Equities have fallen largely because of reductions in absolute 昀椀nanced emissions in the Equities portfolio. and the publicly-traded sterling credit sleeve within next section) as we feel comparing country-level absolute the portfolio’s value, due principally to asset allocation Changes in the portfolio holdings accounted for a 61 our internally-managed UK hybrid assets (‘UK Credit’). emissions alongside corporate emissions is counterintuitive. changes during the year (see page 10 for SAA changes). per cent reduction, yet we actually saw a 5 per cent Collectively, this accounts for $9.4 billion of our overall The next section looks at the year-on-year changes in increase in company emissions year-on-year. This is assets under management – around a quarter of our overall Our total absolute 昀椀nanced emissions in this portion of emissions on a relative basis, which allows for more most likely driven by the reopening of many industries AUM. This year, we have also started reporting Scope 3 our portfolio have reduced by around 40 per cent over the comparable year-on-year analysis. after two years of production declines due to Covid- emissions, although we are not aggregating them with year, and by 62 per cent since Dec 2020. More speci昀椀cally, related lockdowns. This is disappointing to see, although our Scope 1+2 emissions. Page 24 has more detail on this. Equities reduced by 57 per cent, Credit by 27 per cent and not surprising, and it indicates a strong need to continue UK Credit by 22 per cent since 2021. engaging with companies to encourage more transition- Our total 昀椀nanced emissions in tonnes for 2022 for listed equity and credit holdings planning and for science-based emissions targets to be set. This is why the CDP SBT campaign is so critical. Scope 1+2 Scope 3 emissions Causes of change in PPF Equities 昀椀nanced carbon emissions between 2021 and 2022 (tCO e) (tonnes CO e) 2 emissions 2 PPF AUM Scope 1+2 (tonnes Scope 3 – Scope 3 – assessed carbon data COe) upstream downstream ($m) coverage* 100 -61% 2 100% 5% Equities 170,370 455,226 1,149,779 2,977 99% Credit 233,705 391,542 1,271,796 4,617 82% ) 80 e2 UK Credit 62,509 122,909 191,880 1,769 77% O C Total 昀椀nanced emissions 466,584 969,677 2,613,455 9,363 86% es 60 n n o t ( s * This metric shows the percentage coverage of holdings that have either reported or estimated emissions data and an available 昀椀gure for Enterprise Value n 40 43% o Including Cash (EVIC). EVIC is essential for apportioning absolute 昀椀nanced emissions, but is not always available for 昀椀xed income holdings. Certain i s s information ©2023 MSCI ESG Research LLC. Reproduced by permission; no further distribution. i m e 20 Year-on-year change in our Scope 1+2 total 昀椀nanced emissions for listed equity and credit Percentage change in financed carbon0 tCO e $m PPF Equities 2021 Change in company emissions Change in portfolio holdings PPF Equities 2022 2 or AUM 1,600,000 16,000 14,754 14,522 Certain information ©2023 MSCI ESG Research LLC. Reproduced by permission; no further distribution. 1,400,000 14,000 94,378 12,000 1,200,000 1,000,000 329,106 9,363 10,000 Our total 昀椀nanced emissions for listed equity and credit reduced 800,000 80,412 8,000 by -41 per cent from last year. 796,972 321,205 6,000 600,000 62,509 400,000 395,353 233,705 4,000 200,000 2,000 170,370 0 0 2020 2021 2022 Equities tCO e Credit tCO e UK Credit tCO e AUM (RHS) 2 2 2 Certain information ©2023 MSCI ESG Research LLC. Reproduced by permission; no further distribution.
22 Pension Protection Fund Climate Change Report 2022/23 METRICS AND TARGETS CONTINUED Relative carbon intensity We continue to use three key metrics to assess the relative PPF Equities carbon metrics emissions-based intensity of our portfolios, giving us a fuller picture and allowing us to measure di昀昀erent asset classes 350 and di昀昀erent sizes of portfolio on a like-for-like basis. See c i Appendix D for an explanation of each of these metrics. r 300 et 299 m n 250 Including UK and EM Sovereign Debt emissions in our o 257 243 relative carbon intensities analysis means we can now illi 226 m 200 $ analyse $21 billion or 55 per cent of the total PPF portfolio r pe150 in this way. 154 e2 151 O 122 125 C 100 Equities portfolio: carbon intensity metrics 112 108 es 83 83 n 70 74 The December 2022 carbon footprint analysis for listed n 50 65 57 o Equities shows ongoing progress, with all three metrics T 30 34 seeing a year-on-year fall. The two intensity metrics 0 PPF financed Benchmark PPF financed Benchmark PPF weighted Benchmark dependent on company revenues show higher year- carbon emissions financed carbon carbon intensity financed carbon average carbon weighted average on-year reductions, which implies that the portfolio is (tCO e/$m emissions (tCO e/$m intensity (tCO e/$m intensity carbon intensity 2 2 2 invested) (tCO e/$m invested) revenues) revenues) more exposed to companies operating more e昀케ciently 2 this year (i.e. a lower ratio of emissions per unit of December 2020 December 2021 December 2022 revenue generated). Certain information ©2023 MSCI ESG Research LLC. Reproduced by permission; no further distribution. See Appendix C for However, the Equities Book still has higher relative Equity benchmark. emission intensity than its benchmark. This is mainly Credit portfolio: carbon intensity metrics due to our Active Equities book, whose carbon intensity Financed carbon emissions per $m invested for our global Credit book remained broadly the same as levels are roughly twice the level of the climate-aware last year and 昀椀nanced carbon intensity has reduced. However, the weighted average carbon intensity equity index we introduced last year. As mentioned (WACI) has increased this year, although is still lower than for 2020. Deeper analysis shows the externally- earlier, we have internally evaluated our Equities book managed Credit book is mostly driving this, which we are looking to address through our Climate and the companies accounting for the majority of Watchlist – 昀椀fty companies contributing around a third of our external Credit emissions are on our material high impact 昀椀nanced emissions are now on Climate Watchlist. EOS, our external stewardship manager, and our external managers are engaging with our Climate Watchlist of companies requiring more these names on our behalf. We also ask our external Credit managers for speci昀椀c climate engagement intensive engagement. reporting to ensure maximum oversight of what is driving our 昀椀nanced emissions metrics. PPF Credit carbon metrics c 350 i r 300 318 et m 279 n 250 o 255 illi m 200 $ 204 203 r 192 179 193 194 181 pe150 162 e2 133 O C 100 es 85 n 50 70 n 53 51 57 o 50 T 0 Benchmark Benchmark PPF weighted Benchmark PPF financed PPF financed carbon emissions carbon intensity average carbon weighted average financed carbon financed carbon (tCO e/$m emissions (tCO e/$m intensity (tCO e/$m intensity carbon intensity 2 2 2 invested) (tCO e/$m invested) revenues) revenues) 2 December 2020 December 2021 December 2022 Certain information ©2023 MSCI ESG Research LLC. Reproduced by permission; no further distribution. See Appendix C for Credit benchmark.
23 Pension Protection Fund Climate Change Report 2022/23 METRICS AND TARGETS CONTINUED UK Credit portfolio: carbon intensity metrics We are pleased to see a reduction in all the relative metrics of our internally-managed UK Credit Book this year, particularly the 30 per cent improvement in weighted average carbon intensity (WACI). We are pleased to see a Interestingly, our bought vs sold positions this year have roughly the same contribution to WACI (49 vs 48). Forty-two per cent of the UK Credit book is in new positions, and for existing positions 34 per cent reduction in all the relative saw a reduction in carbon intensity, 13 per cent saw an increase and 3 per cent were unchanged. metrics of our UK Credit PPF UK Credit carbon metrics Book this year, particularly c 350 the 30 per cent improvement i r 300 et in 昀椀nanced carbon emissions m n 250 o per $m invested. illi m 200 $ r 175 pe 150 170 e2 153 153 O C 100 118 108 Emerging Markets es This year we have made a 昀椀rst attempt to assess the n n 50 o 47 relative carbon intensity of our sovereign bonds in T 41 35 0 emerging markets, now that our data provider is able PPF financed carbon emissions PPF financed carbon intensity PPF weighted average carbon intensity to assess 100 per cent of our holdings for carbon (tCO e/$m invested) (tCO e/$m revenues) 2 2 emissions within our EM Sovereign Bonds allocation. December 2020 December 2021 December 2022 As the table below shows, the greenhouse gas Certain information ©2023 MSCI ESG Research LLC. Reproduced by permission; no further distribution. intensity of our EM Sovereign portfolio is lower than the benchmark. This book is mostly allocated to Assessing our UK Gilts exposure Emerging Markets sovereign issuers but there is currently The carbon intensity of our UK Gilts portfolio has marginally increased year on year. But this is due a percentage of the book allocated to US treasuries for to a lower GDP (denominator) rather than higher emissions. In fact, absolute emissions have fallen risk-management purposes. Our EM Benchmark is 25 year on year (from 452 to 409 million tonnes CO e, or 10 per cent). per cent in JP Morgan GBI-EM, 25 per cent in JP Morgan 2 EMBI and 50 per cent in a hypothetical cash position. We follow the PCAF (Partnership for Carbon Accounting Financials) methodology for sovereign To calculate the benchmark’s footprint, we have excluded debt for our UK Gilts’ carbon footprints, which recommends reporting of production emissions. this hypothetical cash (as mentioned earlier, pure cash is This year we revised our methodology to exclude land-use, land-use change and Forestry out-of-scope) but we appreciate that this might overstate (LULUCF), as now recommended by PCAF to avoid distorting results. Hence we have also the emissions of the benchmark relative to the portfolio. restated last year’s results. However, for the UK, this revised approach results in only a minimal change to the intensity metric. PPF EM Sovereign holdings: carbon intensity estimate PPF UK Sovereign holdings: carbon intensity estimate EM Sovereign EM Sovereign Bond Bond Portfolio Benchmark n y 250 o c Carbon intensity i en 217 r 200 (tonnes CO e per $m) 512 784 millr 208 210 2 r u c Coverage 100% 100% pe t 150 n 149 e2 a 142 144 v Note: Based on Production-based emissions (Territorial Approach) from O e C l 100 e EDGAR and GDP data from World Bank – World Development Indicators es r n i n 50 n P Certain information ©2023 MSCI ESG Research LLC. Reproduced by o T GD 0 permission; no further distribution. UK Sovereign carbon intensity UK Sovereign carbon intensity (GDP expressed in GBP) (GDP expressed in USD) December 2020 December 2021 December 2022 Certain information ©2023 MSCI ESG Research LLC. Reproduced by permission; no further distribution.
24 Pension Protection Fund Climate Change Report 2022/23 METRICS AND TARGETS CONTINUED Scope 3 emissions For the 昀椀rst time this year, we are reporting Scope 3 emissions, as led by PPF Scope 3 emissions – PCAF Quality Score breakdown the Climate Change (Governance and Reporting) statutory guidance for Occupational Pension Schemes from the Department for Work & Pensions 1% 4% 11% (DWP). We have opted to focus our analysis on relative-only metrics as we feel 100% 35% absolute carbon emissions might be misleading for two reasons: 昀椀rst, Scope 3 29% emissions are almost entirely estimated, plus there is considerable double- 80% 18% counting across the scopes once Scope 3 is incorporated. 67% 71% Our Scope 3 emissions are estimated, however the majority have a Quality Score 60% 64% of 2 from the PCAF – see chart right (a PCAF Score of 1 presents the lowest data uncertainty and a score of 5 the highest uncertainty). 40% Few companies are currently reporting their Scope 3 emissions and where they do, they rarely cover all Scope 3 emissions categories. MSCI provides estimated Scope 3 20% emissions as a default, which equates to a PCAF Score of 4. Where possible MSCI will use a more sophisticated model which will lead to a PCAF Score of 2. 0 Equities Credit UK Credit PPF Scope 3 emissions – 昀椀nanced carbon emissions (tCO e/$m invested) 2 PCAF Q Score 2 PCAF Q Score 4 Not Covered 600 Certain information ©2023 MSCI ESG Research LLC. Reproduced by permission; no further distribution . 500 Note: Under the Scope 3 Emissions footprint quality score set by Partnership for Carbon 400 386 Accounting Financials (PCAF) Score 1 = lowest data uncertainty and Score 5 = highest data 300 uncertainty. This quality scope is valid for data in ‘Carbon emissions – Scope 3 Intensity (t/USD 200 275 million EVIC) for footprint calculation.’ This is based on estimated Scope 3 emissions using MSCI’s 100 153 85 70 proprietary model. MSCI always defaults to a PCAF quality score of 4, although some sub-models 0 108 use more sophisticated estimation approaches. Equities Credit UK Credit Scope 3 emissions by sector Scope 3 – upstream Scope 3 – downstream Whilst results shown left aggregate Scope 3 emissions across all sectors, we recognise that a few sectors tend to be responsible for a large proportion of PPF Scope 3 emissions – 昀椀nanced carbon intensity (tCO e/$m revenues) Scope 3 emissions, particularly in relation to downstream ‘in-use’ emissions. 2 We have therefore further analysed downstream emissions at a sector level for 1,200 each of the three portfolios. 1,000 976 Key 昀椀ndings are: 800 758 600 • Equities: Energy contributes by far the most to Scope 3 downstream emissions 400 (41 per cent), followed by Industrials (25 per cent), with Materials and Consumer 200 300 300 213 332 Discretionary contributing roughly 12 per cent each 0 • Credit: Energy contributes the most to Scope 3 downstream emissions Equities Credit UK Credit Scope 3 – upstream Scope 3 – downstream (27 per cent) followed by Industrials (26 per cent) and Transportation (14 per cent) • UK Credit: Industrials contribute the most to Scope 3 downstream PPF Scope 3 emissions – weighted average carbon intensity emissions (42 per cent), followed by Utilities (27 per cent) and Transportation (14 per cent). 600 583 500 566 400 300 311 200 254 192 191 100 0 Equities Credit UK Credit Scope 3 – upstream Scope 3 – downstream Certain information ©2022 MSCI ESG Research LLC. Reproduced by permission; no further distribution.
25 Pension Protection Fund Climate Change Report 2022/23 METRICS AND TARGETS CONTINUED High-carbon impact sectors In line with TCFD recommendations, Credit: Overall in our Credit book, we pay particular attention to our high-carbon impact sectors contributed Next steps investment exposure to sectors that more to overall emissions than last year have a higher contribution to global (56 per cent vs 34 per cent in 2021). We continue to engage with carbon emissions. Guided by these companies in these three recommendations, we focus on This is mainly due to an increased sectors – both directly and Utilities, Materials and Energy. contribution by Utilities (17 per cent vs through external managers or 9 per cent), which has seen an increase investor collaborations – to Equities: High-carbon impact both in emissions and asset allocation. encourage a transition to lower- sectors contributed marginally Materials also increased by contribution, carbon activities, especially less to emissions in our Equities with one company contributing to over those companies on our portfolios than last year (67 per cent a third of the sector’s emissions. This Climate Watchlist. vs 73 per cent). company is now part of our Climate Watchlist so will receive enhanced Materials and Utilities decreased attention from us going forward. We their contribution (18 per cent vs have also seen a change in sector 31 per cent, 8 per cent vs 19 per classi昀椀cation for a couple of our cent). However, the contribution credit holdings, for example where from Energy increased substantially the issuance has been re-classi昀椀ed (41 per cent vs 23 per cent). From from Financials to Materials. a risk management perspective, we have identi昀椀ed that 72 per cent UK Credit: Within our UK Credit of the Energy sector emissions are portfolio, the only exposure to high- associated with companies in our carbon impact sectors comes from Climate Watchlist, where targeted Utilities. Despite a slight increase in actions are being incorporated into portfolio allocation to the Utilities our dedicated engagement plans for sector from last year, we have seen a these companies. reduction in the emissions associated with this sector. This is largely due to the companies that we hold reducing their emissions from the previous year. Contribution to overall portfolio carbon emissions by high-impact sectors Equities Credit UK Credit 2022 8% 2022 2022 17% 33% 2021 18% 19% 2021 9% 2021 27% 44% 13% 51% 48% 13% 49% 31% 66% 52% 23% 26% 41% 13% Utilities Materials Energy Other Certain information ©2023 MSCI ESG Research LLC. Reproduced by permission; no further distribution.
26 Pension Protection Fund Climate Change Report 2022/23 METRICS AND TARGETS CONTINUED Forward-looking scenario analysis Within our analysis, we have selected the ‘Aggressive’ physical risk scenario To manage our exposure to climate-related We not only examine throughout, against which to assess the resilience of our portfolios, so we risks e昀昀ectively, we also deploy a number our portfolio in terms can see the largest potential impact of forward-looking tools to assess how our of extreme risks, but on our investments. However, we acknowledge that portfolios might be a昀昀ected by climate also opportunities there are limitations with the currently that will thrive in a available climate scenarios and value- change in the future. These are covered in at-risk methodologies, that could be turn over the next four sub-sections. Net Zero world. under-representing the risk. Recent studies have highlighted, in particular, the lack of integration in the models 1. MSCI Climate Value-at-Risk between transition and physical risks Physical VaR and not factoring in tipping points or As an asset owner, it is important to • Policy VaR feedback loops. We would intuitively stress-test our portfolio and see how its The highest Climate VaR under The location database used by the expect to see a higher Physical VaR in value might be impacted in a range of a disorderly transition is mainly MSCI Climate VaR tool now maps the scenarios where there is less of a scenarios and circumstances. To explore explained by the abrupt need to approximately 270,000 locations, transition or a delayed transition. the impact of climate in our portfolio for a higher and faster reduction including an expansion of the global we extensively analyse one aggregate in emissions. Companies would power plant database. The tool covers 昀椀ve acute risks and 昀椀ve chronic Note metric: Climate Value-at-Risk (‘Climate be required to achieve a bigger risks. Acute hazards are catastrophic Our external data provider MSCI VaR’ or ‘CVaR’). Climate VaR comprises emission reduction and pay a events such as coastal 昀氀ooding, introduced two new datasets ‘Transition VaR’ (comprising Policy VaR higher assumed carbon price, tropical cyclones, 昀氀uvial 昀氀ooding, (Regional Company Exposure to and Technology Opportunities) and face higher electricity costs, and low river 昀氀ow, and wild昀椀re. Chronic Physical Hazards and Regional ‘Physical VaR’, which we extrapolate in absorb higher costs from their value hazards are extreme heat, extreme Physical Hazard Metrics) to our analysis. chain, totalling in a higher Policy cold, precipitation, extreme snowfall, improve accuracy and better align VaR. (Conversely a failed transition and extreme wind. with TCFD recommendations. As detailed on page 14, MSCI has results in low Climate VaR because updated its CVaR models by introducing it assumes no/minimal policy action This enhancement makes year- several enhancements to improve is taken so companies would not be on-year comparisons of Physical accuracy and re昀氀ect more realistic required to decarbonise as much. VaR less meaningful. and plausible scenarios. The updated Plus they would not be forced to models re昀氀ect more ampli昀椀ed results move into renewable energy as than the previous model did, especially quickly or at all.) for a 1.5°C Orderly scenario. However, • Technology opportunities this means that year-on-year analysis As well as assessing risks, we look is no longer directly comparable. ahead to see how opportunities Transition VaR that will thrive in a Net Zero world When stress-testing the Climate VaR of might bene昀椀t our portfolio. The VaR our portfolios, we look at 昀椀ve potential model principally assumes that, climate transition scenarios that align as the world moves towards Net with those developed by the Network for Zero, companies with low-carbon Greening the Financial System (NGFS), technology patents, for example, as described earlier. We choose to split are expected to see positive out orderly and disorderly scenarios performance as the demand for into a 1.5°C and a 2°C scenario to renewable energy/low-carbon acknowledge the signi昀椀cant di昀昀erences technologies increases. in these two temperature outcomes.
27 Pension Protection Fund Climate Change Report 2022/23 METRICS AND TARGETS CONTINUED 1 Climate Value-at-Risk 2022 results by asset class Physical risk In Credit, Physical VaR is primarily The 1.5°C Disorderly scenario continues to present the greatest CVaR for all three of our analysed asset classes. Note: Due to model enhancements by our data Physical risk within Equities is driven accounted for by Extreme Heat provider, the 1.5°C Orderly scenario now presents a worse outcome than the 2°C Disorderly scenario. This is because MSCI has changed the way they calculate mostly by Extreme Heat (17 per cent (7 per cent of the 12 per cent). In terms costs, which is one of the main inputs for Climate VaR. of the 25 per cent of Physical VaR). of sector, Food & Staples Retailing, This is mainly due to Banks – the most Transportation and Utilities have the exposed sector – then Energy and highest exposure; and in terms of Equities We hope our actions to assess and Equities Climate VaR Telecommunications Services. China, regional exposure, the US and China The impact from a 1.5°C Disorderly manage all our assets’ alignment with US, and Japan are the most exposed have the highest exposure. scenario is most signi昀椀cant for Paris targets (see page 13) will further k 25% 25.1% regions to physical risk within the In UK Credit, physical risk is mostly s help to improve this resilience in the i Equities, with a Transition VaR of r Equities book. 20% coming from Coastal Flooding (15 future. For example, Energy is the most at over 16 per cent. The Physical VaR e per cent of the 19 per cent). Capital u for the aggressive physical risks exposed sector within Equities under l 15% 16.5% a Biggest contributing sectors Goods is the most exposed sector; v Transition VaR. As mentioned, 72 per scenario is 25 per cent. Whilst the e 12.5% to physical risks by portfolio Netherlands and United Kingdom Transition VaR is lower than last year cent of the Energy sector emissions at10% m are the most exposed countries. are associated with companies in our li 9.1% (which was 38 per cent), it suggests c l 5% a our Equities portfolio is still not Climate Watchlist. t o 1.7% 3.8% very resilient to scenarios factoring T 0 Banks Note in delayed but forceful action to 3ºC 2ºC 2ºC 1.5ºC 1.5ºC The UK Credit book has some keep global warming within Paris Certain information ©2023 MSCI ESG hot house orderly disorderly orderly disorderly physical risk exposure to other Agreement levels. Research LLC. Reproduced by permission; countries besides the UK. This no further distribution. Transition risk Aggressive physical risk Equities: is because it includes non-UK Ph VaR companies that issue Sterling debt 25% or companies that might have Credit Transportation is the most exposed Global Credit Climate VaR Telecoms Energy assets located elsewhere than UK. sector under Transition VaR across Services For another year, our global Credit 12% If MSCI does not have data for the portfolios registered a lower CVaR, all 昀椀ve scenarios. This is due to k 11.1% underlying credit issuer, we may s the sector being highly exposed to i than our Equities ranging from 12 to r 10% use data from the ultimate parent transition risks around electri昀椀cation at 16 per cent under our 昀椀ve scenarios to approximate the risk, which e 8% u Food & when aggregating both Transition and a move away from fossil fuel l may not be a UK name. a v Staples energy sources. 6% and Physical VaR. Whilst the Physical e Retailing VaR is higher than last year, due to the at 5.2% Technology opportunities m 4% li methodology changes undertaken c Although a 1.5°C Disorderly scenario l 3.4% a by MSCI, the Transition VaR is lower t 2% 2.6% Credit is expected to have the highest – and o 0.8% for both 2°C and 1.5°C disorderly T 0 1.1% Ph VaR hence worst – Climate VaR for all asset scenarios than last year. 3ºC 2ºC 2ºC 1.5ºC 1.5ºC 11% classes we analyse, it is also expected Certain information ©2023 MSCI ESG hot house orderly disorderly orderly disorderly Trans- Utilities to generate the most exposure of all Research LLC. Reproduced by permission; portation scenarios to Technology Opportunities. no further distribution. Transition risk Aggressive physical risk Technology, Buildings and Health have the highest future low-carbon UK Credit However, there is considerable UK Credit Climate VaR technology potential. MSCI’s Even taking into account the exposure in this portfolio to Utilities Capital modelling suggests that the sector methodology changes year-on- companies that have set science- 25% Goods best positioned for low carbon k opportunities is Heavy Manufacturing s based targets. Our expectation is that i year, we have seen Transition VaR r 20% 19.1% in the Equities portfolio, Technology if these companies start delivering on at increase for the UK Credit book. This e UK Credit and semiconductors manufacturing u is likely to be driven by the increased their goals, then the transition risk they l 15% a in the Credit portfolio and Rail and v Ph VaR are exposed to will decline. exposure to Utilities. e 19% Utilities in the UK Credit portfolio. at10% Food & m 10.1% li Staples Utilities 1 The Climate VaR of a company, in any given c l 5% 7.4% Retailing scenario, is simply the present value of the a t 1.6% 5.2% o costs impacts in that scenario divided by T 0 0.8% the current enterprise market value of the 3ºC 2ºC 2ºC 1.5ºC 1.5ºC company. The enterprise market value is Certain information ©2023 MSCI ESG hot house orderly disorderly orderly disorderly computed as the sum of the market values Research LLC. Reproduced by permission; Certain information ©2023 MSCI ESG of a company’s equity and debt. The book no further distribution. Transition risk Aggressive physical risk Research LLC. Reproduced by permission; value of debt is used to proxy the market no further distribution. value of debt at the company level.
28 Pension Protection Fund Climate Change Report 2022/23 METRICS AND TARGETS CONTINUED 2. The Transition Pathway Initiative (TPI) The TPI tool uses publicly-disclosed As mentioned earlier, we use TPI Management Quality scores for PPF Equities information collected by FTSE Russell TPIMQ to measurably track and and validated by the Grantham encourage progress on climate 400 TPIMQ coverage for our Research Institute at the London among our portfolio companies 350 School of Economics to assess nearly and it is embedded within the index es 7% i Equities portfolio has t 8% 700 of the world’s highest-emitting construction for our Equity climate- i 300 u q listed companies on two measures: aware benchmark. For 2023 voting E increased to 17 per cent F 250 decisions, we increased the TPIMQ P P • The TPI Management Quality n of market value from score thresholds for climate-related i (TPIMQ) level assesses a company 200 es voting guidelines. i on how well its management is n 14 per cent last year. a 150 dealing with climate change risks, p Equity m o 100 c from Zero (0) to Four Star (4*). TPI now covers nearly 700 companies . o 1% • The TPI Carbon Performance globally, up from around 400+ last year N 50 (TPICP) measure assesses a so a good expansion rate that is set to 0% 1% company on how e昀昀ective it is at continue as the organisation builds out 0 achieving carbon reduction in line MQ=0 MQ=1 MQ=2 MQ=3 MQ=4/4* its coverage. Coverage for our Equities TPIMQ score with the Paris Agreement or any portfolio has increased from 14 per target it’s set. cent to 17 per cent of market value. Weight in PPF Equities (%) We also see more holdings (percentage TPI Carbon Performance assessments for PPF Equities of market value and number of A substantially higher holdings) achieving the highest TPIMQ 300 scores (MQ=3 and MQ=4/4*). Only 2 per cent of the 17 per cent coverage es250 number of these i t in the portfolio is scored in the i u q lower range. E companies received a 200 5% F In fact, most of our holdings PP TPIMQ Management n i maintained the same score as last year 150 es i Quality level of n and 2 per cent of the book increased a p 100 2% by at least one point. Eight names m three or above. o c constituting less than 1 per cent of the . o 50 book saw their TPIMQ score decrease N 1% 1% by one point. Roughly 4 per cent of the book are new additions as TPI 0 TPIMQ levels increased its coverage this year. Not assessed/ Not aligned Paris/Other 2 Degrees no disclosure Pledges or below Level 0 – Unaware We have seen improvements in the TPICP score Level 1 – Acknowledging Carbon Performance assessments Weight in PPF Equities (%) Level 2 – Building capacity from last year too. The biggest shift Level 3 – Integrating into operational in exposure has been from ‘Not decision-making aligned’ to ‘2 Degrees or below’, which is positive. Level 4 – Strategic assessment Level 4* – Meets all indicators
29 Pension Protection Fund Climate Change Report 2022/23 METRICS AND TARGETS CONTINUED Credit TPIMQ scores for PPF Credit This is the second year that TPI analysis has been extended to our Credit portfolios, which is highlighting some positive 160 Both the Credit and UK year-on-year trends. The TPIMQ coverage for our Credit 140 Portfolio more than doubled (from 4.5 per cent to 10.3 t 6% i d Credit portfolios have seen per cent of the portfolio by value), helped in part by TPI e 120 r C increasing its coverage of bond issuers. Our Credit portfolio 3% F 100 signi昀椀cant improvements in now has 86 per cent of its exposure to companies scored PP n i 3 and above for management quality, up from 83 per cent s 80 e last year. i exposure to the companies’ n a p 60 For TPICP, the portfolio coverage increased by more m scored at least 4 on the o c 40 than two-thirds, and we’ve seen an increase in exposure . o to companies with a carbon performance aligned with N 20 TPIMQ score. 2°C or below (64 per cent of companies compared with 0% 0% 0% 48 per cent last year). 0 MQ=0 MQ=1 MQ=2 MQ=3 MQ=4/4* TPIMQ score Weight in PPF Credit (%) UK Credit TPIMQ scores for PPF UK Credit Although we saw a reduction in TPI coverage in the UK Credit book by market value compared to last year, the 18 number of companies itself has increased, again helped t 16 by the increase in bond issuers in the TPI universe. i d e The breakdown for TPIMQ remains roughly the same: r 14 9% C 88 per cent of the covered companies have achieved a K U 12 management quality score of at least 3 versus 86 per cent F PP 10 last year and none received the lowest score of 0 (same as n i s last year). e 8 i n 5% a The TPICP distribution also saw an increase in companies p 6 m o with carbon performance aligned to a trajectory of 2°C or c 4 . below, at 81 per cent compared to 71 per cent last year. o 2% N 2 0 MQ=0 MQ=1 MQ=2 MQ=3 MQ=4/4* TPIMQ score Weight in PPF UK Credit (%)
30 Pension Protection Fund Climate Change Report 2022/23 METRICS AND TARGETS CONTINUED 3. The Science-Based Targets initiative (SBTi) 4. Portfolio Alignment Metrics We view the SBTi (see last year’s We are pleased to see that currently As detailed earlier, our Portfolio Alignment project delivered a baseline that allows us to understand the report for a full explanation) almost 43 per cent of our Equities Next steps alignment of each of our asset class portfolios against the Paris Agreement to keep global warming within commitment or approved target book by market value has now set or 1.5°C of pre-industrial levels. The chart below summarises our baseline 昀椀ndings by asset class for our portfolio as a key metric for evaluating committed to an SBTi target, up by a Our ultimate desired outcome holdings as at December 2020. Please refer to page 13 for descriptions of our alignment categories. companies’ ambition. The initiative’s third from last year. from a real-world perspective Breakdown of portfolio alignment to Paris Agreement by asset class as at December 2020 (Baseline) aim is to provide companies with is to see companies actually a clearly-de昀椀ned path to reduce Increasing adoption is even more acting to reduce their carbon emissions in line with the Paris pronounced among credit issuers: reductions. However, as the Agreement by setting ambitious, in the UK Credit portfolio it has Equities science-based emissions reduction increased from last year by over energy transition has a multi- targets. As we noted this year, it has 80 per cent to more than half the year pathway, setting clear book demonstrating commitment targets is a step in the right Credit (corporate, cash, EM credit) been instrumental in improving the direction. We will continue to assessment of Paris alignment of by market value. The global Credit encourage more companies to many of our portfolio companies. book is lower at 26 per cent, but this set robust, science-based targets EMD (sov) is still an increase of nearly 50 per (for example, by supporting This year, we have used a new dataset cent on last year. It is also somewhat the CDP SBT Campaign – see within the MSCI ESG platform to expected to be lower due to the LDI UK Sov analyse our portfolios’ exposure to Credit portfolio’s higher allocation page 17) as well as monitoring companies that have either formally to Financials, which fall under a the progress of those that have committed to SBTi targets or had their di昀昀erent SBTi standard, (which is still already set targets. Real Estate targets approved by the initiative. in development). Percentage of portfolio committed to SBTi or SBTi-approved targets (by market value) 2022 Alt Credit 100% PE Core 57% 62% 74% 67% 49% 80% PE Non Core 60% Infra 51% 40% 43% 38% UK Public Credit 33% 20% 26% UK Private Credit 0 PPF Equity PPF Credit PPF 0% 20% 40% 60% 80% 100% Equities benchmark Credit benchmark UK Credit Committed to SBTi or SBTi-approved targets Rest of portfolio Net Zero Aligned Committed to Align/Aligning Not Aligned Insufficient data Certain information ©2023 MSCI ESG Research LLC. Reproduced by permission; no further distribution. We acknowledge we are still relying on proxied data within our assessment for many asset classes, especially in private markets. For Private Equity, Infrastructure, Alternative Credit and UK Private Credit, over 80 per cent of portfolios were proxied. Real Estate was the only private markets portfolio with better disclosure (less than 50 per cent proxied).
31 Pension Protection Fund Climate Change Report 2022/23 METRICS AND TARGETS CONTINUED Implied Temperature Rise (ITR) For asset classes where more established alignment As already mentioned, our improvements in alignment The other forward-looking data metric we have started tracking within our Portfolio Alignment work is Implied Temperature methodologies and data are available, we have been with Paris Agreement targets have largely been driven Rise (ITR). We fully acknowledge there are complexities and assumptions within the methodologies for ITRs, however we use able to rerun our analysis at least once (for Real Estate by more companies setting science-based targets or the outputs as one signal alongside other climate considerations when evaluating our investments. The below chart shows and UK Sovereign/LDI portfolios) and twice in some commitments, as measured by the SBT initiative (SBTi). how our public markets portfolios are tracking in terms of ITRs as at December 2022. cases (Equities, Credit and UK Credit portfolios). The We see this as encouraging, although we appreciate percentage of disclosed data in our Credit and UK that setting a target is only one step in the overall Implied Temperature Rise (°C) Public Credit books has signi昀椀cantly improved over the path needed to align with Net Zero. We still need last year, which gives us greater con昀椀dence about the to see continued progress from setting targets to 3.0 reliability of future results. actually delivering on these targets if we want a ‘real- world’ decarbonisation outcome, something that we 2.5 2.7 In all portfolios apart from our LDI/UK Sovereign incorporate into our engagement strategies for pushing 2.6 portfolio, these reruns have indicated improvements the leaders as well as the laggards. 2.4 2.3 from the baseline. The Equities, Credit (both Global & 2.0 UK) and Real Estate books saw a signi昀椀cant reduction 1.9 2.0 in the ‘Not Aligned’ category and improvements in both 1.5 ‘Aligned’ and ‘Committed to Aligning/Aligning’ in the past two years. 1.0 Progress of portfolio alignment by asset class as at December 2021 and 2022 updates 0.5 31/12/2021 0 Equities Equities Credit Credit UK Credit Internally-managed Equities benchmark Benchmark Credit (inc. Strategic Cash books) 31/12/2022 ITR in degrees C PPF Public market portfolios Benchmarks Credit 31/12/2021 Certain information ©2023 MSCI ESG Research LLC. Reproduced by permission; no further distribution. (corporate, Our 2022 analysis is based on MSCI’s ITR model. We have However, we hold regular dialogue with our external active cash, EM credit) 31/12/2022 adopted this approach as this also incorporates company equity managers to understand their investment rationale targets to some degree, not just projecting out the current for investing in any non-benchmark positions. emissions of a company. Comparing this year’s MSCI ITR 31/12/2021 scores with last year’s show a 0.3°C improvement in the Our Credit benchmark is primarily exposed to developed UK Public Equity portfolio, a 0.2°C improvement in the Credit portfolio markets whereas our Credit portfolio also incorporates Credit and a 0.1°C improvement in the UK Public Credit portfolio. emerging markets corporates, which we appreciate tend to 31/12/2022 We have also provided a carve-out of our internally- be on a slower trajectory towards Net Zero – hence we would managed UK Credit and Strategic Cash holdings, which has expect the slightly higher ITR score for the portfolio. 31/12/2021 a lower temperature alignment than the externally-managed assets of 2°C ITR. LDI UK Sov 31/12/2022 Both the Equity and Credit portfolios have slightly higher ITRs than their benchmarks (2.4°C and 2.3°C respectively), which is to be expected in both situations. Our Equity 1 31/12/2021 benchmark is a climate-aware index that is fully tracked by our passive mandates. However, our active Equity Real Estate mandates have more discretion to follow their own 31/12/2022 investment strategy which can result in a higher ITR. 1 The FTSE Custom All-World Climate Minimum Variance Index. 0% 20% 40% 60% 80% 100% Net Zero Aligned Committed to Align/Aligning Not Aligned Insufficient data
32 Pension Protection Fund Climate Change Report 2022/23 METRICS AND TARGETS CONTINUED Other asset classes – Real Estate Real Estate alignment Real Estate: MV (%) in Assets with High Energy Rankings Real Estate Carbon Emissions This year, we worked with our external consultant to We are pleased that our Real Estate managers reported such Next steps enhance our approach to estimating data to address gaps a high amount of carbon emissions data to us. However, in our Real Estate analysis and to calculate portfolio ITRs we are not comfortable aggregating the emissions reported We would ideally like to report the percentage of our for the Real Estate book. Seven CRREM models were run to United States 63% by the managers yet, as they use di昀昀erent methodologies Real Estate book invested in buildings that are classi昀椀ed capture a combination of regions and building use types. In and there is still a high reliance on estimated emissions. as green or have certi昀椀cates that showcase excellence. addition, we moved from a point-in-time approach to using Half of the book is based on actual emissions and the rest is However, we have received reporting on this for less a 1.5°C carbon budget overshoot approach to align more estimated or not reported. than 40 per cent of the book, so it’s not currently with how our corporate ITRs are generated. Europe 17% meaningful to aggregate or analyse the data. We will From a reporting quality perspective, almost all reported work with managers to obtain better results next year. Results showed an improvement in the overall Real Estate emissions have achieved a PCAF Score of 2 or 4. Although portfolio ITR and only three sub-portfolios have ITRs of almost all managers (96 per cent by market value) reported 2°C or higher. However, we recognise that this was driven emissions, only 67 per cent of them provided the PCAF CASE STUDY largely by moving to a more sophisticated approach Japan/Korea 9% Score. We are engaging with managers to investigate the to applying real estate estimations from the global ESG reason behind this. platform Measurabl. There are still a few sub-portfolios Investing in whose results we are assessing with caution, given the PPF Real Estate – Emissions disclosure and higher percentage of estimated rather than actual data. United 8% PCAF Score distribution sustainable property In particular, our multimanager Real Estate mandate is Kingdom almost entirely based on estimates, given some challenges Real Estate Emissions Disclosure Rate This year we invested in a loan to 昀椀nance the in accessing underlying fund reporting. 0% 10% 20% 30% 40% 50% 60% 70% construction of a state-of-the-art o昀케ce building in Bristol’s business district. The seven-storey property is 100% 40% expected to have a net internal area of 200,000 sq ft Next steps and the capacity to host more than 2,000 employees. 80% At the time of the loan, the building was one of only We will continue to validate results at an individual two under construction in the UK regions to target real-estate asset level with our external managers, 60% 12% Net Zero carbon operations, a BREEAM ‘Outstanding’ prioritising action on assets generating high ITR scores rating for sustainability standards, and an Energy and on the portfolios relying heavily on estimated data. 40% 48% Performance Certi昀椀cate (EPC) A-rating. These classi昀椀cations will put the building at the forefront 20% of sustainable o昀케ce provision in the UK. Assessing the sustainability of our Real Estate assets We are pleased that our all our Real Estate managers provided at least some reporting, and this gave us the 0 opportunity to get an overview of how sustainable Actual Estimated Not Covered our Real Estate book is. We can potentially classify as ‘sustainable’ the assets that have the highest energy rating Real Estate PCAF Score Distribution in their region, hold certi昀椀cates showcasing excellence in sustainability, and/or are classi昀椀ed as green by a credible 90% third party. 80% 82% We have managed to obtain a breakdown of Energy 70% Ranking results for 88 per cent of our Real Estate book. Above right are the percentage of assets that have the 60% Highest Energy Rankings in their area. We break down 50% 昀椀gures by geographic region because we feel an aggregate 40% number would be misleading, given that each region has 30% di昀昀erent standards in their energy performance. 20% 10% 6% 3% 9% 0 0% PCAF PCAF PCAF PCAF PCAF Score 1 Score 2 Score 3 Score 4 Score 5
33 Pension Protection Fund Climate Change Report 2022/23 METRICS AND TARGETS CONTINUED Forestry CASE STUDY Sustainable Assets Forestry is a key asset class where we see sustainable We believe that considering climate-related issues and the investment opportunities. Forestry helps to mitigate CO Leading the transition to a low carbon economy can also bring about 2 emissions by storing carbon, making it one of the few viable restructure of a opportunities from an investment perspective. This year, nature-based investment solutions that can help progress we have started to aggregate a high-level breakdown of towards a Net Zero world. Well-managed forests can also forestry asset the Fund’s exposure to investments that can be classi昀椀ed increase biodiversity. as sustainable (see de昀椀nition right). This is still a work in Leveraging existing positions and progress, and we hope to provide more detail in coming Certi昀椀cation Standards for PPF’s share of timberland manager relationships to optimise years, particularly as green taxonomies become more 2022 future investment exposure is a key established within 昀椀nancial markets. part of our portfolio management Our data providers incorporate some sustainable or 98.5% Certi昀椀ed timberland in accordance process. This year, we ensured low-carbon solutions datapoints or 昀氀ags into their climate with the FSC and/or PEFC that a restructuring of one of our existing hardwood forestry assets reports for public markets, and we have enhanced this with 0.9% Timberland in the process of certi昀椀cation met with our investment and additional green revenue data from our Equity index provider in accordance with the FSC and/or PEFC ESG requirements. (as our Equity climate-aware benchmark index includes Land that is sustainably managed in 0.0% green revenue exposure within its optimisation process). accordance with the FSC and/or PEFC, The Tasmanian Forestry Trust is a but that cannot be certi昀椀ed mature 170,000-hectare hardwood Exposure to Sustainable Assets per asset class: Other 0.5% plantation in Australia. We were able Percentage of to secure long-term direct exposure exposure by We are pleased to see that almost all our assets continue to this important asset by forming asset class to AUM to be certi昀椀ed to the highest international standards (FSC and leading a consortium of three sustainable assets (USDm) and/or PEFC). The small percentage that falls under the pension funds to enable a ‘buy- out’. In this way we were able to Equities 7.0% $185 Category ‘Other’ is allocated to new planting sites, and the meet the liquidity requirements of Credit 4.7% $159 manager is expecting the area to be certi昀椀ed when planting existing investors. is completed. UK Credit 9.0% $193 Apart from certi昀椀cation statistics, we also ask our managers EMD Debt 0.8% $11 to report carbon sequestration data. All of them have Forestry 100.0% $1,164 reported to us, however since there is no standardised Other Private Markets 3.5% $433 methodology yet, we are unable at the moment to compare and aggregate data. To address this, we are working with What we have classi昀椀ed as ‘sustainable’: our external consultant to establish a methodology. • Equities: Companies with green revenue exposure or exposure to products and services classi昀椀ed as low-carbon solutions • Credit, UK Credit, EMD Debt: Bonds classi昀椀ed as Green, Social, Sustainability Bond or Sustainability Linked (across corporate, sovereign and supranational issuers) • Forestry: Forests that are certi昀椀ed by international bodies and/or are managed in a sustainable manner • Other Private Markets: Infrastructure Equity and Debt renewable power assets. We have some underlying information about some of our Private Markets assets, especially those within our Infrastructure Equity and Debt portfolios. However, because the information is not standardised by format or source, it is currently challenging and very resource-intensive to identify. We have therefore started by including a few assets that are more straightforward to classify at this stage (e.g. renewable power assets) but will continue to re昀椀ne this for future reports.
34 Pension Protection Fund Climate Change Report 2022/23 METRICS AND TARGETS CONTINUED Measuring and managing the impact of our operations Addressing our own environmental impacts We continue to work to reduce our electricity consumption CASE STUDY Most of our material exposure to climate-related risks through greater energy e昀케ciency where possible. As the exists in the downstream Scope 3 category 15 ‘昀椀nanced table overleaf shows, our Scope 2 location-based emissions Our devices have a emissions’ in our investment value chain. However, we have steadily fallen as energy e昀케ciency has improved, with Lowering our organisational emissions support and re昀氀ect the UK Government’s commitment to a 34 per cent reduction since our 2019/20 baseline year. through digital adoption heavy environmental reduce its impact on the environment. Therefore, we’re As Net Zero for our ‘easier’ direct organisational emissions cost. Working in also reporting our ambitions, commitments and targets has already been achieved, we are now focused on how Recent digital transformation at the PPF has prioritised sustainability under the Greening Government Commitments (GGC) we can reduce our organisational emissions within our and helped us achieve a range of carbon e昀케ciencies. collaboration with where possible. value chain across Scope 3 categories 1, 6 and 7 (purchased goods & services, business travel and employee commuting/ By migrating all our data and technology services to cloud-based platforms our colleagues to Over the last year, we conducted a review of the PPF’s own such as Microsoft Azure, we’ve made signi昀椀cant reductions in the PPF’s environmental impacts as a business to establish a baseline. remote working). organisational energy emissions. For example, in March 2022, our physical reduce our corporate Given the availability of data, we selected our 2019/20 Business travel on-premises data centres consumed 7,111kWh of power. By March 2023, 昀椀nancial year as the most appropriate baseline year and following the cloud migration, this had fallen to 2,951kWh. devices helps to will use this as a basis to measure progress on reducing We have started to take account of our business travel our organisational impacts. We have intentionally excluded activities in our Scope 3 emissions analysis. A challenge Adopting cloud-based services has also allowed employees to use their reduce our overall 2020/21 and 2021/22 from our measurement of progress is how best to capture employees’ travel data, so currently, own phones for work purposes, reducing the need for PPF-issued mobile operational as the lockdown periods during the 2020–22 COVID-19 we use travel expense invoices to calculate emissions. phones by 72 per cent. Being able to collaborate more easily digitally has pandemic means the data would not accurately re昀氀ect Business travel remains an essential element of our allowed us to reduce the number of printers by 33 per cent, which has also carbon footprint. our business-as-usual activities. business, particularly when carrying out due diligence meant reduction in toner cartridge disposal, paper usage and site support. of our investments and key suppliers. However, we are Assessing our o昀케ces working to understand its impacts and will focus on The PPF o昀케ces in Croydon and Cannon Street are based encouraging employees to consider alternatives where Simon Liste in shared-lease buildings so we have limited control over possible. Scope 3 emissions are already lower than them, nor complete access to activity data and systems. our 2019/20 baseline year by 12 per cent as the table, Chief Technology O昀케cer We mainly source energy-use data from our building overleaf, shows. managers, but have used estimates of our share of usage Our suppliers when information is not available to us. To improve the accuracy of our reporting, we have restated our Scope 2 We now consider sustainability in all our procurement location-based emissions data for 2021/22 and 2020/21 to strategies and assess the ESG practices and commitments also include our data centre energy consumption. of suppliers in many tenders. This includes reviewing suppliers’ Net Zero commitments, carbon reduction plans, Both of these o昀케ce buildings are already very e昀케cient, with commitment to ESG reporting to meet TCFD requirements, no direct combustion facilities onsite and BREEAM ratings of and Diversity & Inclusion reporting. ‘Excellent’ and ‘Very Good’ respectively. All of the electricity our o昀케ces use is sourced via 100 per cent renewable Our Sustainable Procurement Statement and Policy was electricity tari昀昀s, which have been in place since October approved at the end of the 2022/23 昀椀nancial year. This 2019. Therefore, our direct organisational Greenhouse captures our procurement approach and governs our Gas emissions (Scope 1 and 2) are e昀昀ectively zero using practices. We communicate our commitment to working a Scope 2 market-based approach. Our data centres have with suppliers who share our ambition for sustainable also sourced 100 per cent renewable electricity during the business practices including reducing and reporting on reporting period. their own carbon emissions and environmental impact.
35 Pension Protection Fund Climate Change Report 2022/23 METRICS AND TARGETS CONTINUED A summary of our Organisational Scope 1, 2 and 3 emissions Emissions (in tonnes using a Scope 2 location-based approach) Sources of Travel Emissions in 2022/23 PPF operations – summary of carbon emissions 350 1% All emissions units in tonnes of carbon dioxide equivalent (tCO e) unless stated otherwise 2 60 % change 300 7% from 275 0 2019/20 2019/20 250 262 2 0% (baseline) 2020/21 2021/22 2022/23 baseline 229 53 200 Energy consumption used to 181 calculate emissions in kWh 1,076,231 1,123,197 1,076,948 936,935 -13% 150 Scope 1 emissions See footnote 1 0 0 0 0 – Location-based 100 See footnote 2 275.1 261.9 228.7 181.2 -34% 50 92% Scope 2 emissions Market-based 0 0 0 0 See footnotes 0 3 & 4 160.5 0 0 0 -100% 2019/20 2020/21 2021/22 2022/23 Domestic by air Scope 3 emissions See footnote 5 60.3 0.2 2.3 53.2 -12% Scope 1 – Energy Emissions Scope 2 – Energy Emissions Scope 3 – Travel Emissions Domestic by other means (location-based) Total Scope 1, 2 and 3 emissions International by air (gross) See footnote 6 335.4 262.1 231.0 234.4 -30% Emissions (in tonnes using both a Scope 2 location-based and Scope 2 International by other means Total Scope 1, 2 and 3 emissions market-based approach) (net) See footnote 7 220.8 0.2 2.3 53.2 -76% Notes: 300 275.1 300 1 Scope 1 covers direct emissions from owned or controlled sources. Our two shared-lease o昀케ce buildings are already e昀케cient, with no direct 261.9 combustion facilities on-site, and BREEAM ratings of ‘Excellent’ or ‘Very Good’ respectively. So our Scope 1 Greenhouse Gas Emissions from 250 228.7 250 fossil fuel combustion are zero (0). 2 A location-based method re昀氀ects the average emissions intensity of grids on which energy consumption occurs (using mostly grid-average 200 60.3 181.2 200 emission factor data). Emissions are calculated using DEFRA conversion factors. 3 A market-based method re昀氀ects emissions from electricity that companies have purposefully chosen (or their lack of choice). It derives emission factors from contractual instruments, which include any type of contract between two parties for the sale and purchase of energy 150 160.5 150 bundled with attributes about the energy generation, or for unbundled attribute claims. 4 All the electricity our o昀케ces use is sourced via 100 per cent renewable electricity tari昀昀s, which have been in place in both o昀케ces since 100 100 the end of October 2019. For the seven months (April to October 2019) we have calculated our market-based emissions as: 275.10*(7/12) = 160.48 (tCO e), where total location-based emissions for 2019/2020 were 275.10 tCO e. 2 2 5 Our Scope 3 organisational emissions include emissions from business travel only at present. 50 53.2 50 6 Our total gross emissions are calculated by aggregating our Scope 1, Scope 2 location-based and Scope 3 business travel emissions. 0 0.2 2.3 0 7 Our total net emissions are calculated by aggregating our Scope 1, Scope 2 market-based and Scope 3 business travel emissions. 0 0 2019/20 2020/21 2021/22 2022/23 Scope 1 – Energy Emissions Scope 2 – Energy Emissions Scope 3 – Travel Emissions (market-based) Scope 2 – Energy Emissions (location-based)
36 Pension Protection Fund Climate Change Report 2022/23 Setting aspirational targets Every year, we look to use the 昀椀ndings that come out of the analysis for our TCFD reporting to see how we might improve how we monitor, manage and reduce the carbon emissions connected to our investments and organisational activities. This year we have set some formal targets to re昀氀ect our ambition. Climate-related KPIs for Our key climate-related targets are: 2. Continue t o source 100 per cent of our purchased 1. Ensur e at least 80 per cent of our Climate Watchlist electricity for our o昀케ces through renewable tari昀昀s Areas we can control 2023/24 昀椀nancial year companies are making disclosures on emissions, each year. The PPF is committed to acting responsibly and with a view to standardising how this is reported. Bot h of our UK o昀케ces were moved to 100 per cent transparently, while generating a good, risk-based renewable electricity tari昀昀s in October 2019 and we Scope 1 Scope 2 investment return to meet the needs of our members and As mentioned ear lier, we are extremely supportive of monitor this annually to ensure this continues. The stakeholders. We have chosen to focus our targets on those the CDP as a global corporate disclosure mechanism same goes for our data centres. Direct emissions Indirect emissions areas that are most important to us and where we believe o昀昀ering standardised reporting for climate change and of owned/ from generation of we can make the biggest di昀昀erence. we strongly encourage our investee companies to report 3. W ork towards achieving Net Zero for our operations operated assets purchased energy in their annual disclosure campaign. by 2035. Through our Sustainability Strategy, we have identi昀椀ed • Building some key performance indicators (KPIs) for 2023/24 that Of our Climat e Watchlist, 84 per cent of companies W e are committed to supporting the UK Government’s are directly linked to our four sustainability goals to help participated in CDP’s 2022 Disclosure process. We are Net Zero by 2050 target and are taking all reasonable management us measure our progress and enable our stakeholders to pleased to see a good level of initial disclosure from steps as an organisation to achieve this for our own hold us to account. Initially, however, a lot of our work will many of the highest emitters in our portfolio. However, operations by 2035 or sooner. Areas we can in昀氀uence focus on developing processes and improving transparency we also recognise that some of these disclosures are not before we can start to see the impact of our activities. meeting the full standard of CDP reporting as yet, so we W e have already achieved Net Zero for our operational Our sustainability goals are supported by more speci昀椀c will be actively encouraging these companies to improve Scope 1 and 2 emissions, with no emissions arising from objectives or milestones for each team. their reporting. fossil fuel use. So our focus going forward will be on Scope 3 what we can do to achieve Net Zero in our Scope 3 operational supply chain and travel emissions. Scope 3 Indirect emissions from rest of 昀椀nanced emissions from our Investments will be value chain activities considered separately. Ac hieving this depends on our level of control and Operational Financed in昀氀uence with stakeholders. We have reasonable • Procurement & • Investments control over our direct emissions (Scope 1 and Scope supply chain 2), but we can only in昀氀uence our indirect emissions • Travel (Scope 3) to a degree. For example, we can only reduce emissions across our supply chain and investments if our suppliers and portfolio companies or issuers reduce their own emissions or otherwise contribute to the global transition to Net Zero. W e have chosen 2035 as our target Net Zero date because we believe that it provides a reasonable timeframe for advancements in both data transparency and technological solutions. Our preference is to reduce emissions as much as possible. Therefore, we will only consider using high-quality carbon o昀昀sets to o昀昀set those emissions we cannot reduce.
37 Pension Protection Fund Climate Change Report 2022/23 Appendices Appendix A Our commitment to the TCFD A summary of where each TCFD recommendation is covered within this climate disclosure The Task Force on Climate-Related Financial Disclosures TCFD Pillars TCFD recommended climate disclosure Climate disclosure references (TCFD) guidance was created by the Financial Stability Board to help companies and investors voluntarily disclose climate-related 昀椀nancial risks clearly, consistently and Governance a. Describe the board’s oversight of climate-related risks Pages 07–09 reliability to help lenders, insurers and investors make and opportunities. informed decisions. Disclose the organisation’s We’ve formally supported the TCFD framework since 2018 governance around climate-related b. Describe management’s role in assessing and managing Pages 07–09 and have continually implemented it across our investment issues and opportunities. climate-related risks and opportunities. process. We share our progress in our annual Responsible Investing (RI) reports, which also detail our stewardship activities and work as an active owner of securities and Strategy a. Describe the climate-related risks and opportunities the Pages 10, 13 real assets. organisation has identi昀椀ed over the short, medium and long-term. Considering the impacts of climate change on our Disclose the actual and potential impacts investments is one of the three priorities within our of climate-related risks and opportunities b. Describe the impact of climate-related risks and opportunities Pages 10–13 RI strategy. on the organisation’s business, strategy on the organisation’s businesses, strategy and 昀椀nancial planning. and 昀椀nancial planning where such We’re committed to: information is material. c. Describe the resilience of the organisation’s strategy, Pages 12–14, 26–32 • Implementing the TCFD taking into consideration di昀昀erent climate-related scenarios, We’re continuously applying and implementing TCFD including a 2 degree or lower scenario. recommendations – and are always looking for ways to improve transparency and management of climate risks in our portfolio. Risk Management a. Describe the organisation’s processes for identifying Pages 10–15 • Assessing transition risks and physical risks and assessing climate-related risks We take a phased approach to analysing how exposed Disclose how the organisation identi昀椀es, our portfolio is to risk in the global transition to a low- assesses and manages climate-related risks. b. Describe the organisation’s processes for managing Pages 16–18 carbon economy, optimising relevant data as and when climate-related risks. it becomes available. We are also starting to assess the physical risks that climate change presents to our c. Describe how processes for identifying, assessing, and Pages 07–12 portfolio, while recognising that data on this is at a very managing climate-related risks are integrated into the early stage. organisation’s overall risk management. • Engaging with our fund managers We work tirelessly with our fund managers across all strategies, asset classes and markets to ensure they Metrics and Targets a. Disclose the metrics used by the organisation to assess Pages 15, Appendix D consider, manage and report to us the climate-related climate-related risks and opportunities in line with its strategy risks and opportunities our investments might face. Disclose the metrics and targets and risk management process. • Collaborating with industry used to assess and manage relevant We are committed to engaging with our industry climate-related risks and opportunities b. Disclose Scope 1, Scope 2, and, if appropriate, Scope 3 Pages 21–24, 35 peers, policymakers, regulators and the wider investor where such information is material. GHG emissions, and the related risks. community to further best practice in climate-related risk disclosure – supporting not only the TCFD but also c. Describe the targets used by the organisation to manage Page 36 Climate Action 100+, the PAII, and CDP. climate-related risks and opportunities and performance against targets.
38 Pension Protection Fund Climate Change Report 2022/23 APPENDICES CONTINUED Appendix B Appendix C PPF climate change policy Disclosure metrics from the 2022/23 Annual Report and Accounts Beliefs temperature rise this century to well As a long-term investor, we have below 2°C and aim to limit the increase PPF carbon footprint listed equities Scope 1 and 2 metrics a duty to consider all 昀椀nancially to 1.5°C. % Change from material risk factors in our investment 2022 2021 2020 2021 to 2022 decisions, including climate-related. Manager expectations Metrics based on investor allocation (EVIC) We believe climate change can We expect our external managers to e) 170,370 395,353 796,972 -57% Total 昀椀nanced carbon emissions (tCO materially impact businesses, markets understand and integrate material 2 e/$m invested) 57 65 122 -12% and economies globally in a number climate-related risks into their analysis Financed carbon emissions (tCO 2 of ways, from a societal perspective and investment process. This includes Financed carbon emissions intensity (tCO e/$m revenues) 112 151 226 -26% as well as environmental. undertaking carbon footprinting 2 and scenario analysis, assessing Metrics based on portfolio weights (WACI) We’ve developed a speci昀椀c climate e/$m revenues) 108 154 243 -30% asset exposure to physical risks, and Weighted average carbon intensity (tCO change policy, as we see climate 2 engaging with issuers, where relevant Equity benchmark weighted average carbon intensity (tCO e/$m revenues)* 83 83 299 – change as a systemic and non- for their asset class. 2 diversi昀椀able concern that has the Market value of the Fund’s equities covered by carbon data ($m) 2,948 6,090 6,528 potential to signi昀椀cantly a昀昀ect the In monitoring the exposure and Proportion of the Fund’s equities for which data is available (%) 99% 99% 98% value of our investments across performance of our external managers, the short, medium and long-term, we’ll review how they’re managing PPF carbon footprint corporate credit Scope 1 and 2 metrics throughout the global economy. We climate-related risks and opportunities, % Change from also believe that opportunities can including voting and engaging with 2022 2021 2020 2021 to 2022 exist and be exploited for companies issuers on climate-related issues, and assets well-positioned for the and how they’re reporting to us on Metrics based on investor allocation (EVIC) transition to a low-carbon economy. their actions. e) 233,705 321,205 329,106 -27% Total 昀椀nanced carbon emissions (tCO 2 e/$m invested) 51 50 53 +1% Financed carbon emissions (tCO Assessment Collaboration 2 e/$m revenues) 179 204 192 -12% Financed carbon emissions intensity (tCO We recognise the complexity and We also collaborate with the wider 2 barriers to identifying and assessing the investment community on climate Metrics based on portfolio weights (WACI) forward-looking 昀椀nancial materiality change issues, as a signatory to e/$m revenues) 181 133 318 +36% Weighted average carbon intensity (tCO of climate-related impacts on our the Principles for Responsible 2 Credit benchmark weighted average carbon intensity (tCO e/$m revenues) 162 279 255 -42% investments. However, we seek to Investment (PRI) and as a member of 2 assess their exposure to climate-related the Institutional Investor Group on Market value of the Fund’s corporate credit covered by carbon data ($m) 4,475 6,451 6,214 risks and opportunities through a range Climate Change (IIGCC). We seek to of metrics and analysis, as the tools encourage greater climate disclosure Proportion of the Fund’s corporate credit for which data is available (%) 96% 89% 93% available to measure these evolve. through supporting initiatives such as Source: Certain information ©2023 MSCI ESG Research LLC. Reproduced by permission; no further distribution (PPF holdings as of 31/12/2022). Equity benchmark = FTSE Custom All-World Climate CDP and the Task Force on Climate- Minimum Variance Index. Credit benchmark = Bloomberg Barclays Global Aggregate Credit Index. Consideration will be given to the related Financial Disclosures (TCFD), * Equity benchmark changed from FTSE All-World Minimum Variance Index to FTSE Custom All-World Climate Minimum Variance Index on 1 August 2021. potential impacts on asset prices and and through engaging with companies return expectations across both short identi昀椀ed by Climate Action 100+, so Metric de昀椀nitions: and longer-term time horizons, and • Total Financed Carbon Emissions: Measures the Scope 1 + Scope 2 tonnes of CO equivalent emissions for which an investor is responsible by their total overall 昀椀nancing. Emissions are that exposure to climate risks (and 2 how this could inform our decisions opportunities) can be better understood. apportioned across all outstanding shares and bonds (% Enterprise Value including cash). around strategic asset allocation and • Financed Carbon Emissions: Measures the Scope 1 and 2 tonnes of CO equivalent emissions, for which an investor is responsible, per $ million invested, by their total overall 昀椀nancing. 2 portfolio construction. Reporting and engagement Emissions are apportioned across all outstanding shares and bonds (% Enterprise Value including cash). • Financed Carbon Intensity: Measures the carbon e昀케ciency of a portfolio, de昀椀ned as the ratio of Scope 1 and 2 tonnes of CO equivalent emissions for which an investor is responsible to We’ll communicate and engage on 2 We will seek to oversee all new and the revenues for which an investor has a claim by their total overall 昀椀nancing. Emissions and sales are apportioned across all outstanding shares and bonds (% Enterprise Value including cash). existing investment arrangements in the actions and progress that have • Weighted Average Carbon Intensity (WACI): Measures a portfolio’s exposure to carbon-intensive companies, de昀椀ned as the portfolio weighted average of companies’ Carbon Intensity (Scope 1 been taken around our climate change and 2 tonnes of CO equivalent emissions per $ million of revenues). a way that takes account of climate strategy to relevant bene昀椀ciaries and 2 transition and adaptation risks, as • Enterprise value including cash (EVIC): Market capitalisation at 昀椀scal year-end date + preferred stock + minority interest + total debt. well as resilience, opportunities and stakeholders, reporting in line with inclusivity, in line with the 2015 Paris TCFD guidance for asset owners. Agreement commitment to keep global (Last reviewed December 2022.)
39 Pension Protection Fund Climate Change Report 2022/23 APPENDICES CONTINUED Appendix D Carbon metric equations Our carbon footprint calculations Total Financed Carbon Emissions in tonnes CO e: 2 current value of investment in entity X entity’s GHG emissions We report a range of carbon Relative carbon intensity ( Entity’s Enterprise Value including cash ) emissions-based metrics for our listed To give the fullest picture of the carbon global equity and credit investment intensity of our portfolio and so we holdings to align with both TCFD and can compare di昀昀erent portfolios on as Financed Carbon Emissions per million dollars invested Partnership for Carbon Accounting close to a like-for-like basis as we can, Financials (PCAF) guidance. We are we use three key measures: metric (may be shown in other currencies too): also guided by the DWP’s work around current value of investment in entity proposed metrics for pension funds. • Financed carbon emissions per X entity’s GHG emissions million dollars invested metric ( Entity’s Enterprise Value including cash ) Although our year-end is 31 March, we Measuring the Financed Carbon review our climate exposure metrics Emissions per million dollars to 31 December. This allows for the invested helps us understand the current portfolio value ($m) greatest coverage of climate data, carbon emissions being 昀椀nanced by such as the annual corporate CDP the size of our investment portfolio. Financed Carbon Intensity per million dollars revenue responses made available to investors • Financed carbon emissions per each autumn. million dollars revenue metric metric (may be shown in other currencies too): Our preferred metric for assessing Measuring the Financed Carbon current value of investment in entity carbon risk exposure on a day-to-day Intensity per million dollars of ( Entity’s Enterprise Value including cash X entity’s GHG emissions ) basis is the Weighted Average Carbon revenue helps us understand the Intensity (WACI). We feel it gives us carbon e昀케ciency of our portfolio, the greatest coverage in 昀椀xed income i.e., how e昀케cient the companies where we have more signi昀椀cant are at generating output per tonne current value of investment in entity X entity’s revenue exposure and allows us to compare of carbon. ( Entity’s Enterprise Value including cash ) similar types of assets and portfolios, • Weighted Average Carbon regardless of investment size. Intensity (WACI) metric Weighted Average Carbon Intensity Absolute 昀椀nanced emissions As recommended by the TCFD, we use the WACI footprint to monitor metric (where normalisation factor is entity’s revenues, but other normalisation factors can be used): For absolute carbon emissions, our portfolios’ exposure to carbon- we measure the total operational intensive companies. It’s 昀氀exible current value of investment in entity entity’s GHG emissions Scope 1 and Scope 2 carbon enough to use across asset classes ( current portfolio value X normalisation factor ) emissions (based on the de昀椀nition and gives us greater coverage in set by the Greenhouse Gas (GHG) 昀椀xed income portfolios. Protocol) using data from MSCI ESG Weighted Average Carbon Intensity for EM Sovereign Research. To calculate our apportioned Constituents (tonnes CO e/ $M GDP nominal) ‘ownership’ of each investment, we’ve 2 used Enterprise Value Including Cash Measures a portfolio’s exposure to carbon-intensive economies, de昀椀ned as the portfolio weighted (EVIC) as recommended by the PCAF. average of sovereigns’ GHG Intensity (emissions/GDP). Sovereign constituents tonnes CO e/$m GDP nominal 2 current value of investment sovereign issuer’s GHG emissions i X i ( current portfolio value sovereign issuer’s $M GDP ) i Weighted Average Carbon Intensity for UK Sovereign Constituents (tons CO e/ PPP-Adjusted GDP): Measures 2 a portfolio’s exposure to the UK economy, de昀椀ned as the portfolio weighted average of sovereigns’ GHG Intensity (emissions/GDP). We have calculated this metric based on PCAF’s latest recommendations. Sources: Sovereign GHG without LULUCF from United Nations Framework Convention on Climate Change (UNFCCC) and PPP-Adjusted GDP from World Bank. Sovereign Emission Intensity Formula based on PCAF standard (see page 116 of https://carbonaccounting昀椀nancials.com/昀椀les/downloads/PCAF-Global-GHG-Standard.pdf): Sovereign GHG without LULUCF / PPP adjusted GDP.
40 Pension Protection Fund Climate Change Report 2022/23 APPENDICES CONTINUED Appendix E Appendix F MSCI disclaimer Our climate change voting guidelines This disclosure was developed using information from MSCI Climate change is a key area of focus for us, and Net Zero Climate-related Shareholder Proposals: For European ESG Research LLC or its a昀케liates or information providers. stewardship is a fundamental part of our approach to companies, we will be reviewing any shareholder proposals Although the Pension Protection Fund’s information management of climate-related risks. Read our Climate related to climate change internally. providers, including without limitation, MSCI ESG Research Change Policy for more details. Through our stewardship Companies on the PPF’s Climate Engagement Watchlist: LLC and its a昀케liates (the ‘ESG Parties’), obtain information provider and participation in collaborative initiatives, we (the ‘Information’) from sources they consider reliable, none expect tangible progress around Net Zero and work with Shareholder meetings at companies on our Climate Watchlist of the ESG Parties warrants or guarantees the originality, both our managers and companies to encourage the will also be reviewed internally by the ESG Team. This accuracy and/or completeness, of any data herein and transition to a low-carbon economy. process will allow additional analysis around the progress expressly disclaim all express or implied warranties, including being made against our internally-set targets. A vote against those of merchantability and 昀椀tness for a particular purpose. In order to measurably track and encourage progress on management may be necessary if we consider there has The Information may only be used for your internal use, may climate, we utilise the management quality assessment of been inadequate progress. not be reproduced or redisseminated in any form and may companies by the Transition Pathway Initiative (TPI). We (Last reviewed March 2023.) not be used as a basis for, or a component of, any 昀椀nancial are also informed by the Climate Action 100+ Net Zero instruments or products or indices. Further, none of the Benchmark for those companies included in this assessment. Information can in and of itself be used to determine which We also will be guided in our voting by the industry initiatives securities to buy or sell or when to buy or sell them. None around Net Zero alignment for both asset owners and our of the ESG Parties shall have any liability for any errors or asset managers. omissions in connection with any data herein, or any liability For 2023, we have increased the thresholds for climate- for any direct, indirect, special, punitive, consequential or any related voting guidelines as noted below: other damages (including lost pro昀椀ts) even if noti昀椀ed of the possibility of such damages. Transition Pathway Initiative Management Quality score: All European and Australian companies in all sectors below Level 4; all coal, oil, gas, utilities and automotive companies below Level 4 vs. Level 3 for autos in 2022; below Level 3 for all remaining sectors/companies in US and Asia and Emerging Markets; Climate Action 100+ Benchmark: Companies that have no medium-term targets in place as identi昀椀ed by indicator 3 of the Climate Action 100+ Benchmark; Coal: Companies identi昀椀ed as expanding coal-昀椀red infrastructure by the Global Coal Exit List or companies that have signi昀椀cant dependence on coal without a su昀케ciently ambitious timeline and strategy for coal phaseout; and Deforestation: Companies that score below 10 on the Forest 500 ranking (assesses companies’ disclosure and management of deforestation risks); Financial institutions that score 0 on the Forest 500 ranking.
Renaissance 12 Dingwall Road Croydon CR0 2NA T: 020 8406 2107 www.ppf.co.uk